Spain (Kingdom of Spain), ES
Spain: Independent country in southwestern Europe with territories in the Mediterranean Sea, the Atlantic Ocean and northern Africa
About

Country Snapshot
Kingdom of Spain at a glance
Kingdom of Spain currently has 2,243 quality-checked populated place pages and 19 state or regional pages linked on MapSof.
Mapped cities & towns
2,243
These counts use a stricter populated-place filter so the main lists stay focused on real city and town pages.
States & regions
19
Open related pagesLargest city
MadridPopulation 3,266,126
Top linked places
Quick Facts about Kingdom of Spain
| Population | 49,315,949 |
| Country | Spain |
| Different from | Español |
| Plate code | E |
| Area | 505990 km2 |
| Official name | Королівство Іспанія, Španělské království, Regne d'Espanya, royaume d’Espagne, España, Kingdom of Spain, Reino de España, Espainiako Erresuma |
| Continent | Europe, Africa |
| Easternmost point | Point(4.327 39.876722222), Point(3.322194444 42.3195) |
| Northernmost point | Point(-7.6905 43.792222222), Point(-7.689277777 43.791222222) |
| Latitude & Longitude | 40.0000,-4.0000 |
| Legislative body | Cortes Generales |
| Named for | Hispania |
| Official language | Spanish, Basque, Galician, Catalan, Occitan |
| Capital | Madrid |
| Time Zone | UTC+02:00, UTC±00:00, UTC+01:00, UTC+01:00 |
| Local time | 16:50:06 (17th July 2026) |

Geography
Kingdom of Spain is located at 40°0'0"N 4°0'0"W (40.0000000, -4.0000000). It has 7 neighbors: Portugal, Mauritania, Gibraltar, Morocco, France, Andorra and Union.
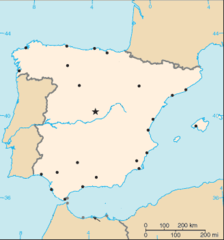
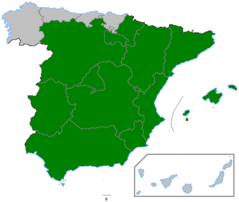
Spain map
The largest city of Kingdom of Spain is Madrid with a population of 3,266,126. Other cities include, Valenzuela population 620,422, Palma population 416,065, Alicante population 334,887 and Valladolid population 298,412. See all Kingdom of Spain cities & populated places.
Official website of Kingdom of Spain
Official WebsiteCompare Kingdom of Spain with
- Catalonia
- Navarre
- La Rioja
- Community of Valencia
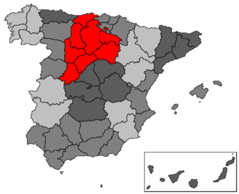
- Castile and León
- Basque Autonomous Community
- Spanish Sahara
- Asturias
- Balearic Islands
- Canary Islands
- Cantabria
- Community of Madrid
- Aragon
- Plazas de soberanía
- Ceuta
- Galicia
- Castile-La Mancha
- Region of Murcia
- Andalusia
- Melilla
- Extremadura
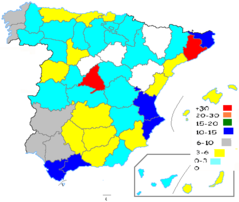
Demographics
| Year | Population | % Change | Method |
|---|---|---|---|
| 1960 | 30,455,000 | - | estimation process |
| 1961 | 30,739,250 | 0.92% | estimation process |
| 1962 | 31,023,366 | 0.92% | estimation process |
| 1963 | 31,296,651 | 0.87% | estimation process |
| 1964 | 31,609,195 | 0.99% | estimation process |
| 1965 | 31,954,292 | 1.08% | estimation process |
| 1966 | 32,283,194 | 1.02% | estimation process |
| 1967 | 32,682,947 | 1.22% | estimation process |
| 1968 | 33,113,134 | 1.3% | estimation process |
| 1969 | 33,441,054 | 0.98% | estimation process |
| 1970 | 33,814,531 | 1.1% | estimation process |
| 1971 | 34,191,678 | 1.1% | estimation process |
| 1972 | 34,502,705 | 0.9% | estimation process |
| 1973 | 34,817,071 | 0.9% | estimation process |
| 1974 | 35,154,338 | 0.96% | estimation process |
| 1975 | 35,530,725 | 1.06% | estimation process |
| 1976 | 35,939,437 | 1.14% | estimation process |
| 1977 | 36,370,050 | 1.18% | estimation process |
| 1978 | 36,872,506 | 1.36% | estimation process |
| 1979 | 37,201,123 | 0.88% | estimation process |
| 1980 | 37,439,035 | 0.64% | estimation process |
| 1981 | 37,740,556 | 0.8% | estimation process |
| 1982 | 37,942,805 | 0.53% | estimation process |
| 1983 | 38,122,429 | 0.47% | estimation process |
| 1984 | 38,278,575 | 0.41% | 2018-01-01T00:00:00Z |
| 1985 | 38,418,817 | 0.37% | estimation process |
| 1986 | 38,535,617 | 0.3% | estimation process |
| 1987 | 38,630,820 | 0.25% | estimation process |
| 1988 | 38,715,849 | 0.22% | estimation process |
| 1989 | 38,791,473 | 0.19% | estimation process |
| 1990 | 38,850,435 | 0.15% | estimation process |
| 1991 | 38,939,049 | 0.23% | estimation process |
| 1992 | 39,067,745 | 0.33% | estimation process |
| 1993 | 39,189,400 | 0.31% | estimation process |
| 1994 | 39,294,967 | 0.27% | estimation process |
| 1995 | 39,387,017 | 0.23% | estimation process |
| 1996 | 39,478,186 | 0.23% | estimation process |
| 1997 | 39,582,413 | 0.26% | estimation process |
| 1998 | 39,721,108 | 0.35% | estimation process |
| 1999 | 39,926,268 | 0.51% | estimation process |
| 2000 | 40,263,216 | 0.84% | estimation process |
| 2001 | 40,756,001 | 1.21% | estimation process |
| 2002 | 41,431,558 | 1.63% | estimation process |
| 2003 | 42,187,645 | 1.79% | estimation process |
| 2004 | 42,921,895 | 1.71% | estimation process |
| 2005 | 43,653,155 | 1.68% | estimation process |
| 2006 | 44,397,319 | 1.68% | estimation process |
| 2007 | 45,226,803 | 1.83% | estimation process |
| 2008 | 45,954,106 | 1.58% | estimation process |
| 2009 | 46,362,946 | 0.88% | estimation process |
| 2010 | 46,576,897 | 0.46% | estimation process |
| 2011 | 46,742,697 | 0.35% | estimation process |
| 2012 | 46,773,055 | 0.06% | estimation process |
| 2013 | 46,617,825 | -0.33% | estimation process |
| 2014 | 46,512,199 | -0.23% | estimation process |
| 2015 | 46,449,565 | -0.13% | estimation process |
| 2016 | 46,484,062 | 0.07% | (Worldbank) |
| 2017 | 46,528,024 | 0.09% | estimation process |
| 2018 | 46,797,754 | 0.58% | (Worldbank) |
| 2019 | 47,076,781 | 0.59% | (Worldbank) |
| 2026 | 49,315,949 | 4.54% |
Map & Images (more maps)
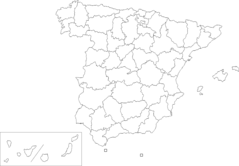
Provinces of Spain (blank Map)
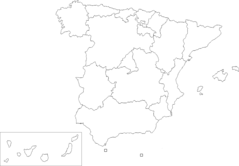
Ccaa of Spain (blank Map)
Spain Municipalities
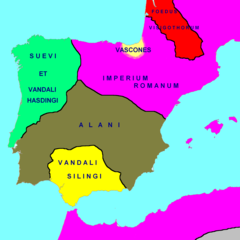
Hispania 418 Ad
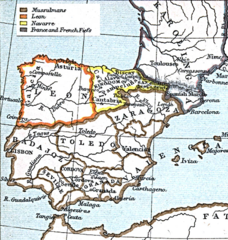
Leon 1030
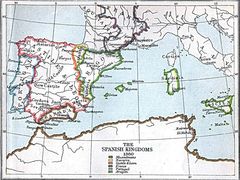
Spanish Kingdoms 1360
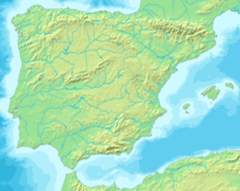
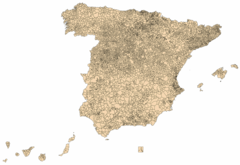
Mapa Iberia Minifisico
000 Spanja Harta
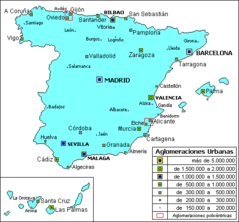
Agloesp
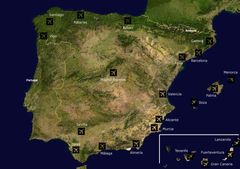
Airports Spain
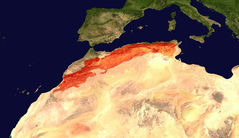
Atlasrange
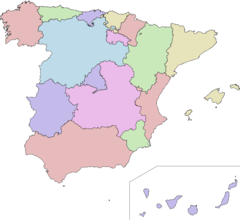
Autonomous Communities of Spain No Names
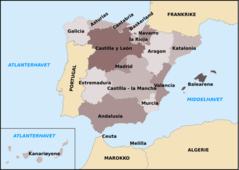
Autonomous Communities of Spain With Other Countries No
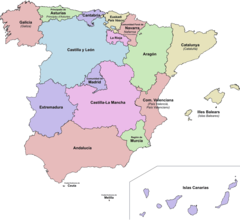
Autonomous Communities of Spain
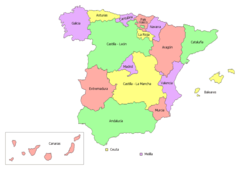
Autonomous Communities of Spain 01

Autonomous Communities of Spain Interlang
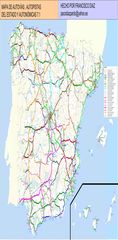
Autovia Mapas
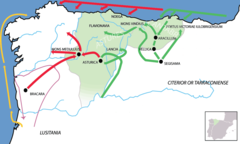
Bellum Asturicum Cantabricum
Capraboinspain
Carrefour In Spain