Mauritania (Islamic Republic of Mauritania), MR
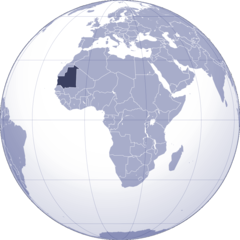
Mauritania: Located in Northwest Africa, it is the eleventh largest country in Africa.
About

Country Snapshot
Islamic Republic of Mauritania at a glance
Islamic Republic of Mauritania currently has 7 quality-checked populated place pages and 12 state or regional pages linked on MapSof.
Mapped cities & towns
7
These counts use a stricter populated-place filter so the main lists stay focused on real city and town pages.
States & regions
12
Open related pagesLargest city
NouakchottPopulation 1,315,000
Top linked places
Quick Facts about Islamic Republic of Mauritania
| Population | 4,927,532 |
| Country | Mauritania |
| Plate code | RIM |
| Area | 1030700 km2 |
| Official name | la République islamique de Mauritanie, Mauritania |
| Continent | Africa |
| Easternmost point | Point(-4.8333 25.0) |
| Northernmost point | Point(-8.67 27.3) |
| Latitude & Longitude | 20.2500,-10.5000 |
| Legislative body | Mauritanian Parliament |
| Named for | Mauretania, Moors |
| Official language | Arabic |
| Capital | Nouakchott |
| Establishment | January 01, 1960 (66 years ago) |
| Time Zone | UTC±00:00 |
| Local time | 12:25:21 (27th June 2026) |

Geography
Islamic Republic of Mauritania is located at 20°15'0"N 10°30'0"W (20.2500000, -10.5000000). It has 6 neighbors: Senegal, Mali, Western Sahara, Spain, Morocco and Algeria.
Mauritania map
The largest city of Islamic Republic of Mauritania is Nouakchott with a population of 1,315,000. . See all Islamic Republic of Mauritania cities & populated places.
Compare Islamic Republic of Mauritania with
- Adrar Region
- Brakna Region
- Tiris Zemmour Region
- Assaba Region
- Guidimaka Region
- Trarza Region
- Gorgol Region
- Tagant Region
- Dakhlet Nouadhibou
- Hodh Ech Chargui Region
- Inchiri Region
- Hodh El Gharbi Region
- Nouakchott
Demographics
| Year | Population | % Change | Method |
|---|---|---|---|
| 1960 | 858,316 | - | statistical updating |
| 1961 | 883,366 | 2.84% | statistical updating |
| 1962 | 909,310 | 2.85% | statistical updating |
| 1963 | 936,144 | 2.87% | statistical updating |
| 1964 | 963,865 | 2.88% | statistical updating |
| 1965 | 992,474 | 2.88% | statistical updating |
| 1966 | 1,021,972 | 2.89% | statistical updating |
| 1967 | 1,052,360 | 2.89% | statistical updating |
| 1968 | 1,083,646 | 2.89% | statistical updating |
| 1969 | 1,115,834 | 2.88% | statistical updating |
| 1970 | 1,148,936 | 2.88% | statistical updating |
| 1971 | 1,182,958 | 2.88% | statistical updating |
| 1972 | 1,217,914 | 2.87% | statistical updating |
| 1973 | 1,253,831 | 2.86% | statistical updating |
| 1974 | 1,290,741 | 2.86% | statistical updating |
| 1975 | 1,328,672 | 2.85% | statistical updating |
| 1976 | 1,367,629 | 2.85% | statistical updating |
| 1977 | 1,407,619 | 2.84% | statistical updating |
| 1978 | 1,448,677 | 2.83% | statistical updating |
| 1979 | 1,490,842 | 2.83% | statistical updating |
| 1980 | 1,534,141 | 2.82% | statistical updating |
| 1981 | 1,578,670 | 2.82% | statistical updating |
| 1982 | 1,624,427 | 2.82% | statistical updating |
| 1983 | 1,671,233 | 2.8% | statistical updating |
| 1984 | 1,718,837 | 2.77% | statistical updating |
| 1985 | 1,767,099 | 2.73% | statistical updating |
| 1986 | 1,815,983 | 2.69% | statistical updating |
| 1987 | 1,865,686 | 2.66% | statistical updating |
| 1988 | 1,916,611 | 2.66% | statistical updating |
| 1989 | 1,969,295 | 2.68% | statistical updating |
| 1990 | 2,024,163 | 2.71% | statistical updating |
| 1991 | 2,081,380 | 2.75% | statistical updating |
| 1992 | 2,140,957 | 2.78% | statistical updating |
| 1993 | 2,202,966 | 2.81% | statistical updating |
| 1994 | 2,267,433 | 2.84% | statistical updating |
| 1995 | 2,334,388 | 2.87% | statistical updating |
| 1996 | 2,403,805 | 2.89% | statistical updating |
| 1997 | 2,475,726 | 2.91% | statistical updating |
| 1998 | 2,550,307 | 2.92% | statistical updating |
| 1999 | 2,627,739 | 2.95% | statistical updating |
| 2000 | 2,708,095 | 2.97% | statistical updating |
| 2001 | 2,791,403 | 2.98% | statistical updating |
| 2002 | 2,877,431 | 2.99% | statistical updating |
| 2003 | 2,965,667 | 2.98% | statistical updating |
| 2004 | 3,055,425 | 2.94% | statistical updating |
| 2005 | 3,146,164 | 2.88% | statistical updating |
| 2006 | 3,237,713 | 2.83% | statistical updating |
| 2007 | 3,330,037 | 2.77% | statistical updating |
| 2008 | 3,422,901 | 2.71% | statistical updating |
| 2009 | 3,516,077 | 2.65% | statistical updating |
| 2010 | 3,609,420 | 2.59% | statistical updating |
| 2011 | 3,702,763 | 2.52% | statistical updating |
| 2012 | 3,796,141 | 2.46% | statistical updating |
| 2013 | 3,537,368 | -7.32% | statistical updating |
| 2014 | 3,930,896 | 10.01% | (Worldbank) |
| 2015 | 4,046,301 | 2.85% | (Worldbank) |
| 2016 | 4,163,534 | 2.82% | (Worldbank) |
| 2017 | 4,420,184 | 5.81% | statistical updating |
| 2018 | 4,403,319 | -0.38% | (Worldbank) |
| 2019 | 4,525,696 | 2.7% | (Worldbank) |
| 2026 | 4,927,532 | 8.15% |
Map & Images (more maps)

Mauritania Flag Map
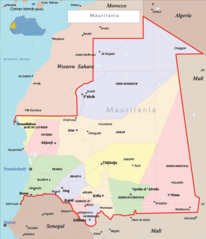
Mauritania Political Map