World GDP by Country 2025 Map: Top Economies and Global Economic Scale
Explore Global GDP in 2025
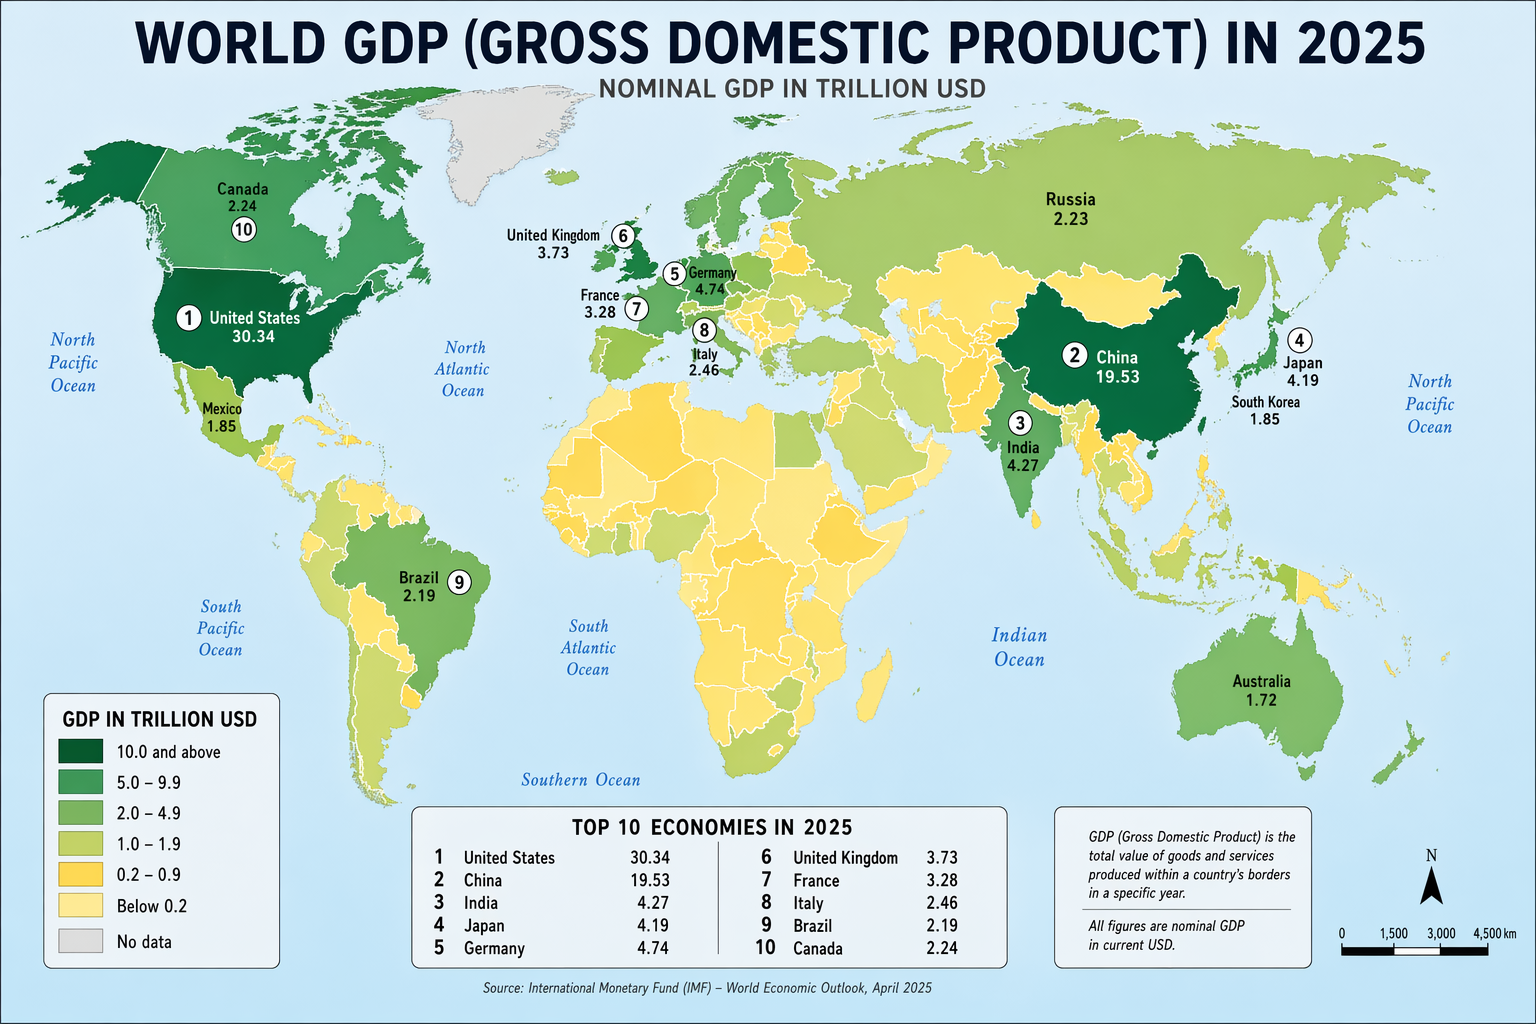
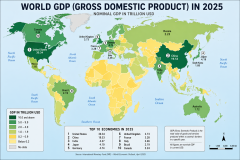
This thematic world map visualizes GDP (Gross Domestic Product) by country in 2025, using a clear gradient from light yellow for lower GDP values to dark green for the largest economies. A concise legend displays GDP ranges in trillion USD, making it easy to compare national economic output at a glance. Country borders are rendered with high clarity, and the top 10 economies are prominently labeled to highlight global leaders.
How to Read and Use This Map
Use the color scale and legend to quickly interpret each country’s economic size and understand regional patterns in global production and market potential. The map’s clean, modern cartographic style ensures readability, while the labeled top economies provide immediate context for international comparisons, trade analysis, and investment research. This visualization is ideal for students, analysts, and policymakers seeking a clear, up-to-date snapshot of the world economy in 2025.
More World Static Maps
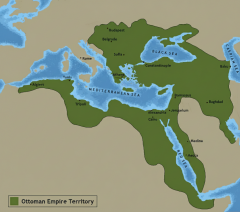
Ottoman Empire Map: Imperial Height & Decline (1683)
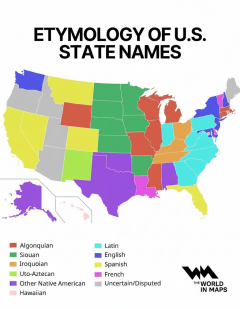
US State Name Origins: An Etymological Map
World GDP by Country 2025 Map: Top Economies and Global Economic Scale
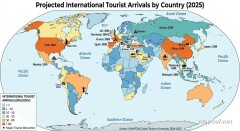
Projected 2025 World Map: International Tourist Arrivals
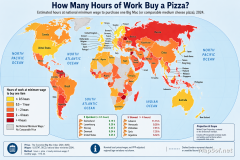
Hours of Work for a Pizza: Global Minimum Wage vs Big Mac (2024)
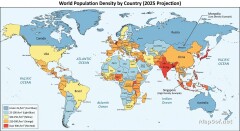
Projected World Population Density 2025 Heat Map
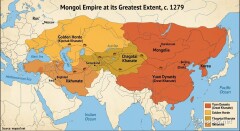
Mongol Empire 1279 Map: The Four Khanates at Their Peak
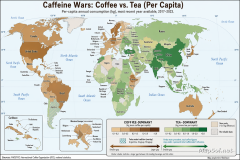
Caffeine Wars: Coffee vs. Tea Consumption by Country (Per Capita)
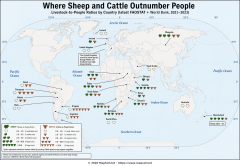
Where Sheep and Cattle Outnumber People (Global Ratios)
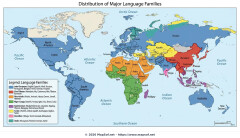
World Map: Distribution of Major Language Families
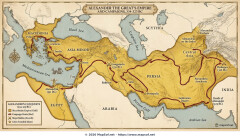
Map of Alexander the Great's Conquests (334–323 BC)
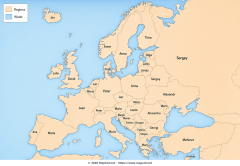
Most Common First Names in Europe – Country-by-Country Map
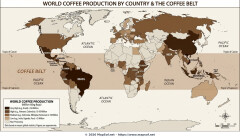
World Map: Coffee Production by Country & The Coffee Belt
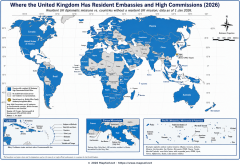
Where the UK Has Resident Embassies and High Commissions (2026)
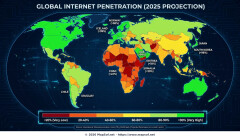
Global Internet Connectivity Map: 2025 Projected Penetration Rates
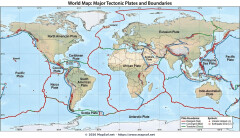
World Map of Major Tectonic Plates, Boundaries, and Geohazards
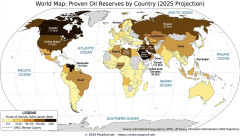
World Map: Projected Proven Oil Reserves by Country, 2025
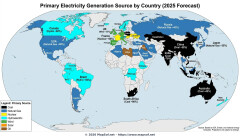
Dominant Electricity Sources Worldwide 2025 Forecast Map
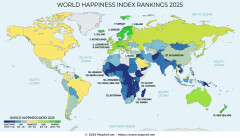
2025 Global Happiness Index Map: Country Rankings & Scores
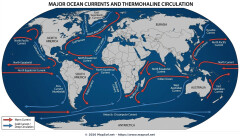
Global Ocean Currents Map: Warm, Cold, and Thermohaline Circulation
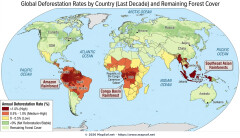
World Map: Deforestation Rates and Forest Cover (Last Decade)
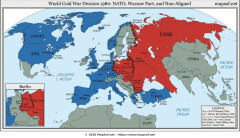
Cold War Map 1980: NATO vs Warsaw Pact & Iron Curtain
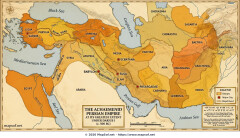
Achaemenid Persian Empire Map 500 BC: Satrapies Under Darius I
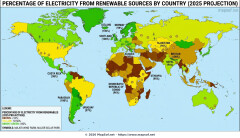
Projected 2025 World Map: Renewable Electricity Percentage by Country
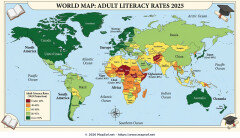
World Adult Literacy Rates Map 2025 Forecast
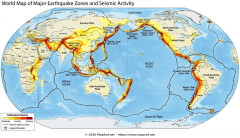
Global Seismic Activity Map: Major Earthquake Zones & The Ring of Fire
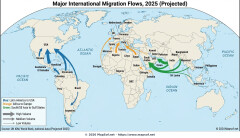
Projected World Migration Flows 2025 Map
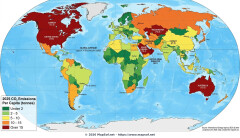
Projected World CO2 Emissions Per Capita Map 2025
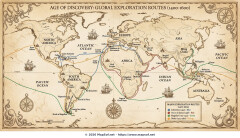
Age of Discovery: Voyages of Columbus, da Gama, Magellan & Drake