Santa Monica, California
Santa Monica: A city in Los Angeles County, California.
About
Santa Monica is a city located in the county of Los Angeles in the U.S. state of California. Its population at the 2010 census was 89,736. After 10 years in 2020 city had an estimated population of 90,024 inhabitants.
The city was created 256 years ago in 1769.
Santa Monica is a coastal city located west of downtown Los Angeles, California. It was founded in 1875 and officially incorporated in 1886. The completion of railroads connecting it to LA spurred Santa Monica's early growth as a resort town.
Key Facts About Santa Monica
Population: Approximately 92,000 as of 2019
Economy: Major employers include the City of Santa Monica, Santa Monica College, Universal Music Group, and ET Whitehall. Tourism, tech, healthcare, and retail are also vital.
Geography: Santa Monica spans just over 8 square miles along the coast of the Pacific Ocean. The city features over 3 miles of beaches and is home to the Santa Monica Pier.
Things to Do in Santa Monica
Top attractions and activities in Santa Monica include:
- Santa Monica Pier - Iconic pier with a Ferris wheel, carnival games, street performers, food, and views of the bay.
- Third Street Promenade - Popular outdoor pedestrian mall lined with shops, restaurants, movie theaters and street performers.
- Santa Monica State Beach - Stretch of coastline along Santa Monica Bay known for its white sands and seaside vibe.
- Annenberg Community Beach House - Beach club with oceanfront pools, lounge areas, and historic guest house.
- Bergamot Station Arts Center - Former trolley station now home to art galleries, creative shops and eateries.
In summary, Santa Monica offers scenic beaches, great shopping and dining, cultural attractions, and a fun seaside vibe near metropolitan LA.

Quick Facts about Santa Monica
| Population | 90,024 (2020) |
| Country | United States of America |
| State | California (United States) |
| County | Los Angeles County |
| Postal code | 90401–90411 |
| Official name | Santa Monica |
| Water as percent of area | 0.01% |
| Land as percent of area | 99.99% |
| Latitude & Longitude | 34.0195,-118.4912 |
| Named for | Monica of Hippo |
| Altitude | 105 feet / 32 meters |
| Establishment | August 03, 1769 (256 years ago) |
| Time Zone | UTC−08:00, UTC−07:00 |
| Local time | 13:34:09 (17th July 2026) |
| Population growth | 0.32% (2010-2020) |

Geography
Santa Monica is located at 34°1'10"N 118°29'28"W (34.0194500, -118.4911900). It has 2 neighbors: Brentwood and Los Angeles.
Santa Monica map
Official website of Santa Monica
Official Website- Fujinomiya
- Hamm
- Hechuan District
- Mazatlán
- Sant'Elia Fiumerapido
- Sirolo
Demographics
The population of Santa Monica increased by 0.32% in 10 years.
| Year | Population | % Change | Method |
|---|---|---|---|
| 1880 | 417 | - | census |
| 1890 | 1,580 | 73.61% | census |
| 1900 | 3,057 | 48.32% | census |
| 1910 | 7,847 | 61.04% | census |
| 1920 | 15,252 | 48.55% | census |
| 1930 | 37,146 | 58.94% | census |
| 1940 | 53,500 | 30.57% | census |
| 1950 | 71,595 | 25.27% | census |
| 1960 | 83,249 | 14% | census |
| 1970 | 88,289 | 5.71% | census |
| 1980 | 88,314 | 0.03% | census |
| 1990 | 86,905 | -1.62% | census |
| 2000 | 84,084 | -3.35% | census |
| 2010 | 89,736 | 6.3% | census |
| 2011 | 90,476 | 0.82% | estimation process |
| 2012 | 91,327 | 0.93% | estimation process |
| 2013 | 92,050 | 0.79% | estimation process |
| 2014 | 92,087 | 0.04% | estimation process |
| 2015 | 92,422 | 0.36% | estimation process |
| 2016 | 92,176 | -0.27% | estimation process |
| 2017 | 91,747 | -0.47% | estimation process |
| 2018 | 91,106 | -0.7% | estimation process |
| 2019 | 90,401 | -0.78% | estimation process |
| 2020 | 90,024 | -0.42% | estimation process |
Demographic Facts
| Estimated population as of July 1, 2019 : | 8,732 |
| Based on demographic estimates as of April 1, 2010 : | 8,597 |
| Based on demographic estimates as of 1 April 2010 : | 1.6% |
| April 1, 2020 Population : | 9,340 |
| April 1, 2010 Population : | 8,612 |
| People under 5 years old, percentage : | 7.3% |
| People under 18 years old, percentage : | 19.1% |
| People over 65 (%) : | 17.5% |
| Female persons, % : | 46.2% |
| White only, percent : | 92.5% |
| Black or African American alone, percent : | 1.1% |
| American Indian and Alaska Native only, % : | 0.0% |
| Asians alone % : | 0.8% |
| Only Native Hawaiians and Other Pacific Islanders, % : | 0.2% |
| % of people who have participated in two or more races : | 5.1% |
| % of Hispanic or Latino : | 4.7% |
| White people, not Hispanic or Latino people, make up the majority of the population. : | 89.5% |
| 2015-2019 Veterans : | 427 |
| Percentage of foreign-born people, 2015-2019 : | 1.7% |
| Rate of owner-occupied housing units, 2015-2019 : | 49.7% |
Economic Facts
| Rate of owner-occupied housing units, 2015-2019 : | 49.7% |
| Owner-occupied housing unit median value, 2015-2019 : | $131,100 |
| From 2015 to 2019, the median selected monthly owner costs - with a mortgage : | $992 |
| Monthly owner costs, without a mortgage, at the median, 2015-2019 : | $374 |
| 2015-2019 median gross rent : | $757 |
| 2015-2019 Households : | 3,262 |
| Population per household, 2015-2019 : | 2.24 |
| Living in the same house a year ago, percentage of people aged one year and up, 2015-2019 : | 70.7% |
| Languages other than English spoken at home, as a percentage of people aged 5 and up, 2015-2019 : | 4.3% |
| Households with computers, %, 2015-2019 : | 86.2% |
| Percentage of households with a broadband Internet subscription, 2015-2019 : | 76.7% |
| Percentage of people aged 25 and up with a high school diploma or higher, 2015-2019 : | 90.4% |
| Bachelor's degree or higher, proportion of people aged 25 and up, 2015-2019 : | 27.0% |
| Percentage of people under the age of 65 who have a disability, 2015-2019 : | 10.4% |
| Persons under the age of 65 who do not have health insurance, as a percentage : | 10.6% |
| Total civilian labor force, percent of population aged 16 and up, 2015-2019 : | 64.3% |
| Female labor force participation in the civilian labor force, as a percentage of the population aged 16 and up, 2015-2019 : | 59.7% |
| Total sales of lodging and food services in 2012 ($1,000) : | 32,960 |
| Total receipts/revenue for health care and social assistance in 2012 ($1,000) : | 89,815 |
| Manufacturers' total shipments in 2012 ($1,000) : | 475,376 |
| 2012 total retail sales ($1,000) : | 289,157 |
| 2012 total retail sales per capita : | $33,658 |
| Mean commute time to work (in minutes), workers aged 16 and up, 2015-2019 : | 16.2 |
| 2015-2019 median household income (in 2019 dollars) : | $47,878 |
| Income per capita in the previous 12 months (in 2019 dollars), 2015-2019 : | $23,714 |
| Percentage of people living in poverty : | 10.6% |
| Total number of businesses in 2012 : | 747 |
| Men-owned businesses in 2012 : | 362 |
| Women-owned businesses in 2012 : | 187 |
| Minority-owned businesses in 2012 : | 45 |
| Non-minority-owned businesses in 2012 : | 606 |
| Veteran-owned businesses in 2012 : | 69 |
| Nonveteran-owned businesses in 2012 : | 571 |
| 2010 population per square mile : | 1,357.6 |
| 2010 land area in square miles : | 6.34 |
| Residential units, July 1, 2019 : | 4,843 |
| Rate of owner-occupied housing units, 2015-2019 : | 74.7% |
| Owner-occupied housing unit median value, 2015-2019 : | $94,100 |
| From 2015 to 2019, the median selected monthly owner costs - with a mortgage : | $967 |
| Monthly owner costs, without a mortgage, at the median, 2015-2019 : | $393 |
| 2015-2019 median gross rent : | $699 |
| 2015-2019 Households : | 4,192 |
| Population per household, 2015-2019 : | 2.38 |
| Living in the same house a year ago, percentage of people aged one year and up, 2015-2019 : | 90.5% |
| Languages other than English spoken at home, as a percentage of people aged 5 and up, 2015-2019 : | 10.8% |
| Households with computers, %, 2015-2019 : | 80.8% |
| Percentage of households with a broadband Internet subscription, 2015-2019 : | 72.1% |
| Percentage of people aged 25 and up with a high school diploma or higher, 2015-2019 : | 91.1% |
| Bachelor's degree or higher, proportion of people aged 25 and up, 2015-2019 : | 18.0% |
| Percentage of people under the age of 65 who have a disability, 2015-2019 : | 4.5% |
| Persons under the age of 65 who do not have health insurance, as a percentage : | 7.1% |
| Total civilian labor force, percent of population aged 16 and up, 2015-2019 : | 63.8% |
| Female labor force participation in the civilian labor force, as a percentage of the population aged 16 and up, 2015-2019 : | 57.1% |
| Total sales of lodging and food services in 2012 ($1,000) : | 5,550 |
| Total receipts/revenue for health care and social assistance in 2012 ($1,000) : | 35,332 |
| Manufacturers' total shipments in 2012 ($1,000) : | 229,347 |
| 2012 total retail sales ($1,000) : | 79,718 |
| 2012 total retail sales per capita : | $7,553 |
| Mean commute time to work (in minutes), workers aged 16 and up, 2015-2019 : | 16.7 |
| 2015-2019 median household income (in 2019 dollars) : | $56,419 |
| Income per capita in the previous 12 months (in 2019 dollars), 2015-2019 : | $29,546 |
| Percentage of people living in poverty : | 11.2% |
| Total number of employer establishments, 2019 : | 295 |
| 2019 total employment : | 3,232 |
| 2019 total annual payroll ($1,000) : | 131,642 |
| Total employment, change in percentage terms, 2018-2019 : | 1.3% |
| 2018 total non-employer establishments : | 779 |
| Total number of businesses in 2012 : | 1,170 |
| Men-owned businesses in 2012 : | 637 |
| Women-owned businesses in 2012 : | 342 |
| Minority-owned businesses in 2012 : | 61 |
| Non-minority-owned businesses in 2012 : | 1,018 |
| Veteran-owned businesses in 2012 : | 137 |
| Nonveteran-owned businesses in 2012 : | 888 |
| 2010 population per square mile : | 18.4 |
| 2010 land area in square miles : | 581.97 |
| Rate of owner-occupied housing units, 2015-2019 : | 59.6% |
| Owner-occupied housing unit median value, 2015-2019 : | $123,300 |
| From 2015 to 2019, the median selected monthly owner costs - with a mortgage : | $978 |
| Monthly owner costs, without a mortgage, at the median, 2015-2019 : | $333 |
| 2015-2019 median gross rent : | $743 |
| 2015-2019 Households : | 2,129 |
| Population per household, 2015-2019 : | 2.63 |
| Living in the same house a year ago, percentage of people aged one year and up, 2015-2019 : | 87.7% |
| Languages other than English spoken at home, as a percentage of people aged 5 and up, 2015-2019 : | 19.6% |
| Households with computers, %, 2015-2019 : | 81.5% |
| Percentage of households with a broadband Internet subscription, 2015-2019 : | 71.6% |
| Percentage of people aged 25 and up with a high school diploma or higher, 2015-2019 : | 70.1% |
| Bachelor's degree or higher, proportion of people aged 25 and up, 2015-2019 : | 13.1% |
| Percentage of people under the age of 65 who have a disability, 2015-2019 : | 15.3% |
| Persons under the age of 65 who do not have health insurance, as a percentage : | 13.2% |
| Total civilian labor force, percent of population aged 16 and up, 2015-2019 : | 52.3% |
| Female labor force participation in the civilian labor force, as a percentage of the population aged 16 and up, 2015-2019 : | 47.3% |
| Total receipts/revenue for health care and social assistance in 2012 ($1,000) : | 35,609 |
| Manufacturers' total shipments in 2012 ($1,000) : | 1,226,401 |
| 2012 total retail sales ($1,000) : | 75,066 |
| 2012 total retail sales per capita : | $13,331 |
| Mean commute time to work (in minutes), workers aged 16 and up, 2015-2019 : | 19.7 |
| 2015-2019 median household income (in 2019 dollars) : | $41,860 |
| Income per capita in the previous 12 months (in 2019 dollars), 2015-2019 : | $24,125 |
| Percentage of people living in poverty : | 13.3% |
| Total number of businesses in 2012 : | 659 |
| Men-owned businesses in 2012 : | 297 |
| Women-owned businesses in 2012 : | 259 |
| Minority-owned businesses in 2012 : | 48 |
| Non-minority-owned businesses in 2012 : | 561 |
| Veteran-owned businesses in 2012 : | F |
| Nonveteran-owned businesses in 2012 : | 592 |
| 2010 population per square mile : | 389.4 |
| 2010 land area in square miles : | 13.82 |
| Rate of owner-occupied housing units, 2015-2019 : | 88.4% |
| Owner-occupied housing unit median value, 2015-2019 : | $223,000 |
| From 2015 to 2019, the median selected monthly owner costs - with a mortgage : | $1,357 |
| Monthly owner costs, without a mortgage, at the median, 2015-2019 : | $367 |
| 2015-2019 median gross rent : | $1,131 |
| 2015-2019 Households : | 1,968 |
| Population per household, 2015-2019 : | 3.31 |
| Living in the same house a year ago, percentage of people aged one year and up, 2015-2019 : | 81.8% |
| Languages other than English spoken at home, as a percentage of people aged 5 and up, 2015-2019 : | 11.7% |
| Households with computers, %, 2015-2019 : | 99.3% |
| Percentage of households with a broadband Internet subscription, 2015-2019 : | 93.2% |
| Percentage of people aged 25 and up with a high school diploma or higher, 2015-2019 : | 96.7% |
| Bachelor's degree or higher, proportion of people aged 25 and up, 2015-2019 : | 21.6% |
| Percentage of people under the age of 65 who have a disability, 2015-2019 : | 5.0% |
| Persons under the age of 65 who do not have health insurance, as a percentage : | 4.2% |
| Total civilian labor force, percent of population aged 16 and up, 2015-2019 : | 74.9% |
| Female labor force participation in the civilian labor force, as a percentage of the population aged 16 and up, 2015-2019 : | 66.6% |
| Total sales of lodging and food services in 2012 ($1,000) : | 6,817 |
| Total receipts/revenue for health care and social assistance in 2012 ($1,000) : | 2,056 |
| 2012 total retail sales ($1,000) : | 114,379 |
| 2012 total retail sales per capita : | $19,707 |
| Mean commute time to work (in minutes), workers aged 16 and up, 2015-2019 : | 24.1 |
| 2015-2019 median household income (in 2019 dollars) : | $74,342 |
| Income per capita in the previous 12 months (in 2019 dollars), 2015-2019 : | $25,855 |
| Percentage of people living in poverty : | 3.0% |
| Total number of businesses in 2012 : | 444 |
| Men-owned businesses in 2012 : | 229 |
| Women-owned businesses in 2012 : | 170 |
| Minority-owned businesses in 2012 : | F |
| Non-minority-owned businesses in 2012 : | 415 |
| Veteran-owned businesses in 2012 : | 38 |
| Nonveteran-owned businesses in 2012 : | 393 |
| 2010 population per square mile : | 1,846.9 |
| 2010 land area in square miles : | 3.01 |
| Rate of owner-occupied housing units, 2015-2019 : | 80.0% |
| Owner-occupied housing unit median value, 2015-2019 : | $353,100 |
| From 2015 to 2019, the median selected monthly owner costs - with a mortgage : | $1,773 |
| Monthly owner costs, without a mortgage, at the median, 2015-2019 : | $434 |
| 2015-2019 median gross rent : | $1,478 |
| 2015-2019 Households : | 16,611 |
| Population per household, 2015-2019 : | 3.85 |
| Living in the same house a year ago, percentage of people aged one year and up, 2015-2019 : | 83.8% |
| Languages other than English spoken at home, as a percentage of people aged 5 and up, 2015-2019 : | 12.7% |
| Households with computers, %, 2015-2019 : | 98.4% |
| Percentage of households with a broadband Internet subscription, 2015-2019 : | 94.4% |
| Percentage of people aged 25 and up with a high school diploma or higher, 2015-2019 : | 97.2% |
| Bachelor's degree or higher, proportion of people aged 25 and up, 2015-2019 : | 46.3% |
| Percentage of people under the age of 65 who have a disability, 2015-2019 : | 4.6% |
| Persons under the age of 65 who do not have health insurance, as a percentage : | 5.4% |
| Total civilian labor force, percent of population aged 16 and up, 2015-2019 : | 69.5% |
| Female labor force participation in the civilian labor force, as a percentage of the population aged 16 and up, 2015-2019 : | 55.4% |
| Total sales of lodging and food services in 2012 ($1,000) : | 48,168 |
| Total receipts/revenue for health care and social assistance in 2012 ($1,000) : | 49,868 |
| Manufacturers' total shipments in 2012 ($1,000) : | 198,144 |
| 2012 total retail sales ($1,000) : | 637,830 |
| 2012 total retail sales per capita : | $12,464 |
| Mean commute time to work (in minutes), workers aged 16 and up, 2015-2019 : | 23.5 |
| 2015-2019 median household income (in 2019 dollars) : | $95,510 |
| Income per capita in the previous 12 months (in 2019 dollars), 2015-2019 : | $29,203 |
| Percentage of people living in poverty : | 6.4% |
| Total number of businesses in 2012 : | 4,379 |
| Men-owned businesses in 2012 : | 2,268 |
| Women-owned businesses in 2012 : | 1,241 |
| Minority-owned businesses in 2012 : | 408 |
| Non-minority-owned businesses in 2012 : | 3,825 |
| Veteran-owned businesses in 2012 : | 248 |
| Nonveteran-owned businesses in 2012 : | 3,856 |
| 2010 population per square mile : | 1,800.1 |
| 2010 land area in square miles : | 26.34 |
Where to Eat in Santa Monica
1Fairmont Miramar Hotel & Bungalows
101 Wilshire Blvd, Santa Monica, CA 90401, United States View details
Phone: +13105767777 | Website available

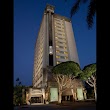
2The Huntley Hotel Santa Monica Beach
1111 2nd St, Santa Monica, CA 90403, United States View details
Phone: +18559985323 | Website available
Where to Stay in Santa Monica
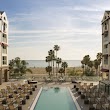
1Shutters on the Beach
1 Pico Blvd, Santa Monica, CA 90405, United States View details
Phone: +13104580030 | Website available

2Loews Santa Monica Beach Hotel
1700 Ocean Ave, Santa Monica, CA 90401, United States View details
Phone: +18778794401 | Website available
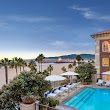
3Hotel Casa del Mar
1910 Ocean Way, Santa Monica, CA 90405, United States View details
Phone: +13105815533 | Website available
4Shore Hotel
1515 Ocean Ave, Santa Monica, CA 90401, United States View details
Phone: +13104581515 | Website available

5JW Marriott Santa Monica Le Merigot
1740 Ocean Ave, Santa Monica, CA 90401, United States View details
Phone: +13103959700 | Website available

Services and Civic Places in Santa Monica
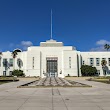
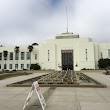
1Santa Monica City Hall
1685 Main St #3205, Santa Monica, CA 90401, United States View details
Phone: +13104588411 | Website available
2City of Santa Monica
1685 Main St, Santa Monica, CA 90401, United States View details
Phone: +13104588411 | Website available
3City of Santa Monica Planning & Community Development Department
1717 4th St #150, Santa Monica, CA 90401, United States View details
Phone: +13104588295 | Website available

4Santa Monica Business Licenses
Finance Department Revenue Division, 1717 4th St #150, Santa Monica, CA 90401, United States View details
Phone: +13104588745 | Website available
5City of Santa Monica - Human Resources Department
1685 Main St #101, Santa Monica, CA 90401, United States View details
Phone: +13104588246 | Website available

6Public Landscape Division
2600 Ocean Park Blvd, Santa Monica, CA 90405, United States View details
Phone: +13104588974 | Website available
7Santa Monica Consumer Affairs
1685 Main St Unit 310, Santa Monica, CA 90401, United States View details
Phone: +13104588336 | Website available
8Santa Monica City Treasurer
1717 4th St #150, Santa Monica, CA 90401, United States View details
Phone: +13104588741 | Website available
9Santa Monica Engineering
Mail Stop, 1685 Main St UNIT 15, Santa Monica, CA 90401, United States View details
Phone: +13104588721 | Website available
10City of Santa Monica Community & Cultural Services Department
2600 Ocean Park Blvd, Santa Monica, CA 90405, United States View details
Phone: +13104588300 | Website available
People born in Santa Monica (200)
People born in Santa Monica, including actor S. Scott Bullock, actress Mary Ellen Popel, singer and actress Edith Peters, .
More notable people
- Peter Stephan Jungk (Austrian American writer) he was born in 19/11/1952
- Barry Boehm (American software engineer) he was born in 16/05/1935
- Jamie Lee Curtis (actress, author) she was born in 22/11/1958
- Lorenzo Lamas (American actor) he was born in 20/01/1958
- Tobey Maguire (American actor and film producer) he was born in 27/06/1975
- Ernie Ball (American entrepreneur) he was born in 30/08/1930
- Shirley Temple (American actress and diplomat (1928-2014)) she was born in 23/04/1928
- Christina Ricci (American actress) she was born in 12/02/1980
- Sean Astin (American actor, director, producer) he was born in 25/02/1971
- Gloria Stuart (American actress (1910-2010)) she was born in 04/07/1910
- Anjelica Huston (American actress) she was born in 08/07/1951
- Erin Sanders (actress) she was born in 19/01/1991
- Robert Trujillo (American Bass Player) he was born in 23/10/1964
- Geraldine Chaplin (British-American actress) she was born in 31/07/1944
- Amber Tamblyn (American actress) she was born in 14/05/1983
- Linda Gray (actress) she was born in 12/09/1940
- Teena Marie (American singer) she was born in 05/03/1956
- Suzanne Vega (American singer) she was born in 11/07/1959
Nearby Schools and Colleges
Schools and campuses linked to Santa Monica, CA. Select a name to open its map and contact details.
| Code | Name | City | ZIP |
|---|---|---|---|
| 116350 | Toni & Guy Hairdressing Academy-Santa Monica | Santa Monica (CA) | 90401 |
| 114114 | Emperor's College of Traditional Oriental Medicine | Santa Monica (CA) | 90403 |
| 121628 | Pardee RAND Graduate School | Santa Monica (CA) | 90401-3208 |
| 122977 | Santa Monica College | Santa Monica (CA) | 90405-1628 |
| 401250 | Yo San University of Traditional Chinese Medicine | Los Angeles (CA) | 90066 |
Nearby Transit Stations (40)
Rail and bus stations connected to Santa Monica, CA. Select a station to open its map and address details.
| Code | Name | Address | Type |
|---|---|---|---|
| WES | Westwood-UCLA, CA | 592 Gayley Ave. | BUS |
| WCH | Westchester, CA | 6860 Park Terrace Drive | BUS |
| ESG | El Segundo, CA | 700 South Douglas Street | BUS |
| VNC | Van Nuys station | 7724 Van Nuys Blvd. | RAIL |
| BUR | Burbank Airport–South station | 3750 Empire Avenue | RAIL |
Other cities in Los Angeles County
Cities, towns, neighborhoods & other populated places in Los Angeles County , CA. (more)
| City Name | Population | Title |
|---|---|---|
| Los Angeles | 3,970,219 | The second most populous city in the United States and the center of the Los Angeles metropolitan area. |
| Long Beach | 454,681 | The second most populous city in California, Long Beach is a major center for business, manufacturing, and tourism. |
| Santa Clarita | 209,990 | The second most populous city in Los Angeles County, California. |
| Glendale | 197,747 | The second most populous city in Los Angeles County, California. |
| Lancaster | 155,822 | The most populous city in Los Angeles County, California. |
| Palmdale | 150,498 | The most populous city in Los Angeles County, California. |
| Pomona | 149,212 | The sixth most populous city in Los Angeles County, California. |
| Torrance | 141,553 | The third most populous city in Los Angeles County, California. |
| Pasadena | 141,045 | The second most populous city in Los Angeles County, California. |
| East Los Angeles | 126,496 | Census-designated place in Los Angeles County, California, United States |
| El Monte | 112,344 | The most populous city in Los Angeles County, California. |
| Downey | 109,202 | The most populous city in Los Angeles County, California. |
| Inglewood | 107,203 | The most populous city in Los Angeles County, California. |
| Santa Maria | 105,851 | The third most populous city in Santa Barbara County, California. |
| West Covina | 103,656 | The most populous city in Los Angeles County, California. |
| Norwalk | 102,635 | The most populous city in Los Angeles County, California. |
Distance to Other Cities
Santa Monica distances to largest California cities