Pico Rivera, California
Pico Rivera: The most populous city in Los Angeles County, California.
About
Pico Rivera is a city located in the county of Los Angeles in the U.S. state of California. Its population at the 2010 census was 62,942. After 10 years in 2020 city had an estimated population of 61,338 inhabitants.
The city was created 68 years ago in 1957.

Quick Facts about Pico Rivera
| Population | 61,338 (2020) |
| Country | United States of America |
| State | California (United States) |
| County | Los Angeles County |
| Postal code | 90660–90662 |
| Phone Area Codes | 562 |
| Water as percent of area | 6.6% |
| Land as percent of area | 93.4% |
| Latitude & Longitude | 33.9831,-118.0967 |
| Altitude | 164 feet / 50 meters |
| Establishment | January 01, 1958 (68 years ago) |
| Time Zone | America/Los_Angeles |
| Local time | 10:40:15 (9th June 2026) |
| Population growth | -2.62% (2010-2020) |
| Weather | 61℉ Mostly Cloudy then Patchy Fog 7-days weather |
Geography
Pico Rivera is located at 33°58'59"N 118°5'48"W (33.9830700, -118.0967300).
Pico Rivera map
Weather
Patchy fog after 5am. Mostly cloudy, with a low around 61. South southwest wind 5 to 10 mph.
7-Day ForecastOfficial website of Pico Rivera
Official WebsiteDemographics
According to census records, the population of Pico Rivera decreased by 2.62% in 10 years.
| Year | Population | % Change | Method |
|---|---|---|---|
| 2010 | 62,942 | - | census |
| 2011 | 63,221 | 0.44% | estimation process |
| 2012 | 63,430 | 0.33% | estimation process |
| 2013 | 63,597 | 0.26% | estimation process |
| 2014 | 63,637 | 0.06% | estimation process |
| 2015 | 63,670 | 0.05% | estimation process |
| 2016 | 63,438 | -0.37% | estimation process |
| 2017 | 63,133 | -0.48% | estimation process |
| 2018 | 62,677 | -0.73% | estimation process |
| 2019 | 62,027 | -1.05% | estimation process |
| 2020 | 61,338 | -1.12% | estimation process |
Demographic Facts
| Estimated population as of July 1, 2019 : | 7,262 |
| Based on demographic estimates as of April 1, 2010 : | 7,737 |
| Based on demographic estimates as of 1 April 2010 : | -6.1% |
| April 1, 2020 Population : | 7,234 |
| April 1, 2010 Population : | 7,743 |
| People under 5 years old, percentage : | 1.4% |
| People under 18 years old, percentage : | 10.3% |
| People over 65 (%) : | 27.5% |
| Female persons, % : | 53.7% |
| White only, percent : | 91.5% |
| Black or African American alone, percent : | 2.8% |
| American Indian and Alaska Native only, % : | 0.5% |
| Asians alone % : | 1.4% |
| Only Native Hawaiians and Other Pacific Islanders, % : | 0.2% |
| % of people who have participated in two or more races : | 3.2% |
| % of Hispanic or Latino : | 2.7% |
| White people, not Hispanic or Latino people, make up the majority of the population. : | 90.2% |
| 2015-2019 Veterans : | 669 |
| Percentage of foreign-born people, 2015-2019 : | 3.9% |
| Rate of owner-occupied housing units, 2015-2019 : | 46.8% |
Economic Facts
| Rate of owner-occupied housing units, 2015-2019 : | 46.8% |
| Owner-occupied housing unit median value, 2015-2019 : | $78,000 |
| From 2015 to 2019, the median selected monthly owner costs - with a mortgage : | $904 |
| Monthly owner costs, without a mortgage, at the median, 2015-2019 : | $514 |
| 2015-2019 median gross rent : | $698 |
| 2015-2019 Households : | 2,868 |
| Population per household, 2015-2019 : | 2.09 |
| Living in the same house a year ago, percentage of people aged one year and up, 2015-2019 : | 80.3% |
| Languages other than English spoken at home, as a percentage of people aged 5 and up, 2015-2019 : | 7.9% |
| Households with computers, %, 2015-2019 : | 83.6% |
| Percentage of households with a broadband Internet subscription, 2015-2019 : | 79.4% |
| Percentage of people aged 25 and up with a high school diploma or higher, 2015-2019 : | 85.7% |
| Bachelor's degree or higher, proportion of people aged 25 and up, 2015-2019 : | 15.1% |
| Percentage of people under the age of 65 who have a disability, 2015-2019 : | 19.9% |
| Persons under the age of 65 who do not have health insurance, as a percentage : | 4.8% |
| Total civilian labor force, percent of population aged 16 and up, 2015-2019 : | 52.3% |
| Female labor force participation in the civilian labor force, as a percentage of the population aged 16 and up, 2015-2019 : | 46.5% |
| Total sales of lodging and food services in 2012 ($1,000) : | 26,890 |
| Total receipts/revenue for health care and social assistance in 2012 ($1,000) : | 79,455 |
| 2012 total retail sales ($1,000) : | 252,365 |
| 2012 total retail sales per capita : | $32,762 |
| Mean commute time to work (in minutes), workers aged 16 and up, 2015-2019 : | 16.3 |
| 2015-2019 median household income (in 2019 dollars) : | $44,870 |
| Income per capita in the previous 12 months (in 2019 dollars), 2015-2019 : | $26,197 |
| Percentage of people living in poverty : | 15.6% |
| Total number of businesses in 2012 : | 621 |
| Men-owned businesses in 2012 : | 439 |
| Women-owned businesses in 2012 : | 90 |
| Minority-owned businesses in 2012 : | F |
| Non-minority-owned businesses in 2012 : | 576 |
| Veteran-owned businesses in 2012 : | 28 |
| Nonveteran-owned businesses in 2012 : | 531 |
| 2010 population per square mile : | 2,991.4 |
| 2010 land area in square miles : | 2.59 |
Where to Stay in Pico Rivera
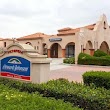
1Howard Johnson by Wyndham Pico Rivera Hotel & Suites
9515 Whittier Blvd, Pico Rivera, CA 90660, United States View details
Phone: +15623950325 | Website available
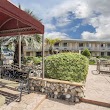
2Knights Inn Pico Rivera
6540 Rosemead Blvd, Pico Rivera, CA 90660, United States View details
Phone: +15629421003 | Website available
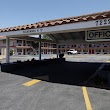
3Americas Best Value Inn Pico Rivera Los Angeles E
7222 Rosemead Blvd, Pico Rivera, CA 90660, United States View details
Phone: +15629496648 | Website available
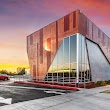
4EPIC Hotel Pico Rivera
4335 Rosemead Blvd, Pico Rivera, CA 90660, United States View details
Phone: +15628423055 | Website available
5Angels Motel Pico Rivera
6623 Rosemead Blvd, Pico Rivera, CA 90660, United States View details
Phone: +15629484566
Services and Civic Places in Pico Rivera
1Pico Rivera City Hall
6615 Passons Blvd, Pico Rivera, CA 90660, United States View details
Phone: +15629422000 | Website available
2City of Pico Rivera Parks & Recreation Department
6767 Passons Blvd, Pico Rivera, CA 90660, United States View details
Phone: +15628014430 | Website available

People born in Pico Rivera (8)
People born in Pico Rivera, including boxer Rico Ramos, actress Jennifer Syme, football player Dennis Morrison, .
More notable people
- Jeanette Jurado (American singer) she was born in 14/11/1965
- Jim Arellanes (American football player) he was born in 30/01/1974
- Cristian Roldan (American association football player) he was born in 03/06/1995
- Jonathan Pérez (football player) he was born in 18/01/2003
- Jonathan Perez (American soccer player, born 2003) he was born in 18/01/2003
Nearby Schools and Colleges
Schools and campuses linked to Pico Rivera, CA. Select a name to open its map and contact details.
| Code | Name | City | ZIP |
|---|---|---|---|
| 443207 | NTMA Training Centers of Southern California | Santa Fe Springs (CA) | 90670 |
| 125763 | Whittier College | Whittier (CA) | 90601 |
| 121886 | Rio Hondo College | Whittier (CA) | 90601-1616 |
| 371690 | Downey Adult School | Downey (CA) | 90241 |
| 449870 | University of the West | Rosemead (CA) | 91770 |
Nearby Transit Stations (46)
Rail and bus stations connected to Pico Rivera, CA. Select a station to open its map and address details.
| Code | Name | Address | Type |
|---|---|---|---|
| LAX | Los Angeles Union Station | 800 North Alameda Street | RAIL |
| PAS | Pasadena, California | 150 South Los Robles Ave. | BUS |
| FUL | Fullerton Transportation Center | 120 East Santa Fe Avenue | RAIL |
| GDL | Glendale Transportation Center | 400 West Cerritos Avenue | RAIL |
| TOA | Torrance, CA | 20575 Hamilton Avenue | BUS |
Closest post offices linked to Pico Rivera.
| Post Office Name | City | ZIP |
|---|---|---|
| Pico Rivera Post Office | Pico Rivera (CA) | 90660 |
| Crossroads Plaza Post Office | Pico Rivera (CA) | 90660 |
| Slauson Post Office | Pico Rivera (CA) | 90660 |
| Montebell Post Office | Montebello (CA) | 90640 |
| Los N Post Office | Whittier (CA) | 90606 |
Other cities in Los Angeles County
Cities, towns, neighborhoods & other populated places in Los Angeles County , CA. (more)
| City Name | Population | Title |
|---|---|---|
| Los Angeles | 3,970,219 | The second most populous city in the United States and the center of the Los Angeles metropolitan area. |
| Long Beach | 454,681 | The second most populous city in California, Long Beach is a major center for business, manufacturing, and tourism. |
| Santa Clarita | 209,990 | The second most populous city in Los Angeles County, California. |
| Glendale | 197,747 | The second most populous city in Los Angeles County, California. |
| Lancaster | 155,822 | The most populous city in Los Angeles County, California. |
| Palmdale | 150,498 | The most populous city in Los Angeles County, California. |
| Pomona | 149,212 | The sixth most populous city in Los Angeles County, California. |
| Torrance | 141,553 | The third most populous city in Los Angeles County, California. |
| Pasadena | 141,045 | The second most populous city in Los Angeles County, California. |
| East Los Angeles | 126,496 | Census-designated place in Los Angeles County, California, United States |
| El Monte | 112,344 | The most populous city in Los Angeles County, California. |
| Downey | 109,202 | The most populous city in Los Angeles County, California. |
| Inglewood | 107,203 | The most populous city in Los Angeles County, California. |
| Santa Maria | 105,851 | The third most populous city in Santa Barbara County, California. |
| West Covina | 103,656 | The most populous city in Los Angeles County, California. |
| Norwalk | 102,635 | The most populous city in Los Angeles County, California. |
Distance to Other Cities
Pico Rivera distances to largest California cities