Tanzania (United Republic of Tanzania), TZ
Tanzania: Located in East Africa, it is known for its vast wilderness areas, including the plains of Serengeti National Park, home to the "big five" game, and Kilimanjaro, Africa's highest mountain.
About

Country Snapshot
United Republic of Tanzania at a glance
United Republic of Tanzania currently has 191 quality-checked populated place pages and 26 state or regional pages linked on MapSof.
Mapped cities & towns
191
These counts use a stricter populated-place filter so the main lists stay focused on real city and town pages.
States & regions
26
Open related pagesLargest city
Dar es SalaamPopulation 4,715,000
Top linked places
Quick Facts about United Republic of Tanzania
| Population | 68,153,004 |
| Country | Tanzania |
| Plate code | EAT |
| Area | 947303 km2 |
| Official name | la République unie de Tanzanie |
| Continent | Africa |
| Northernmost point | Point(32.5 -1.0) |
| Latitude & Longitude | -6.0000,35.0000 |
| Legislative body | National Assembly |
| Named for | Tanganyika, Zanzibar |
| Official language | Swahili, English |
| Capital | Dar es Salaam, Dodoma |
| Establishment | April 26, 1964 (62 years ago) |
| Time Zone | UTC+03:00, East Africa Time |
| Local time | 12:01:40 (10th June 2026) |

Geography
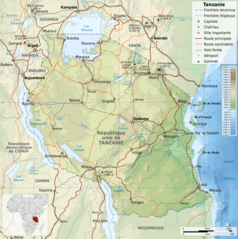
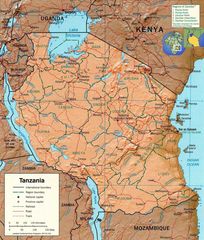
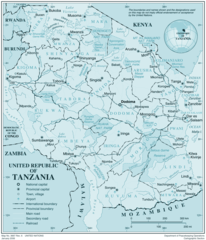
United Republic of Tanzania is located at 6°0'0"S 35°0'0"E (-6.0000000, 35.0000000). It has 9 neighbors: Rwanda, Kenya, Congo Kinshasa, Uganda, Seychelles, Burundi, Zambia, Malawi and Mozambique.
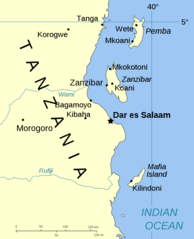
Tanzania map
The largest city of United Republic of Tanzania is Dar es Salaam with a population of 4,715,000. Other cities include, Arusha population 416,442, Mbeya population 291,649, Dodoma population 180,541 and Kigoma population 164,268. See all United Republic of Tanzania cities & populated places.
Official website of United Republic of Tanzania
Official WebsiteCompare United Republic of Tanzania with
- Mtwara Region
- Mbeya Region
- Tabora
- Kigoma Region
- Unguja South Region
- North Pemba Region
- Shinyanga Region
- Mwanza
- Mara Region
- Tanga Region
- Dodoma Region
- Mwanza Region
- Pwani Region
- Manyara Region
- Mount Kilimanjaro
- Tabora Region
- Morogoro
- Dar es Salaam
- Arusha Region
- Iringa Region
- Iringa
- Ruvuma Region
- South Pemba Region
- Mbeya
- Unguja North Region
- Kilimanjaro Region
- Singida Region
- Kagera Region
- Lindi
- Rukwa Region
- Morogoro Region
- Mjini Magharibi Region
- Dar es Salaam Region
- Lindi Region
- Shinyanga
- Kigoma
- Mtwara
Demographics
| Year | Population | % Change | Method |
|---|---|---|---|
| 1960 | 10,074,490 | - | 2018-01-01T00:00:00Z |
| 1961 | 10,373,284 | 2.88% | 2018-01-01T00:00:00Z |
| 1962 | 10,683,653 | 2.91% | 2018-01-01T00:00:00Z |
| 1963 | 11,005,491 | 2.92% | 2018-01-01T00:00:00Z |
| 1964 | 11,338,544 | 2.94% | 2018-01-01T00:00:00Z |
| 1965 | 11,682,873 | 2.95% | 2018-01-01T00:00:00Z |
| 1966 | 12,038,204 | 2.95% | 2018-01-01T00:00:00Z |
| 1967 | 12,405,366 | 2.96% | 2018-01-01T00:00:00Z |
| 1968 | 12,786,833 | 2.98% | 2018-01-01T00:00:00Z |
| 1969 | 13,185,844 | 3.03% | 2018-01-01T00:00:00Z |
| 1970 | 13,604,627 | 3.08% | 2018-01-01T00:00:00Z |
| 1971 | 14,044,585 | 3.13% | 2018-01-01T00:00:00Z |
| 1972 | 14,504,939 | 3.17% | 2018-01-01T00:00:00Z |
| 1973 | 14,983,047 | 3.19% | 2018-01-01T00:00:00Z |
| 1974 | 15,475,026 | 3.18% | 2018-01-01T00:00:00Z |
| 1975 | 15,978,207 | 3.15% | 2018-01-01T00:00:00Z |
| 1976 | 16,491,793 | 3.11% | 2018-01-01T00:00:00Z |
| 1977 | 17,017,107 | 3.09% | 2018-01-01T00:00:00Z |
| 1978 | 17,556,181 | 3.07% | 2018-01-01T00:00:00Z |
| 1979 | 18,111,999 | 3.07% | 2018-01-01T00:00:00Z |
| 1980 | 18,686,808 | 3.08% | 2018-01-01T00:00:00Z |
| 1981 | 19,282,215 | 3.09% | 2018-01-01T00:00:00Z |
| 1982 | 19,898,033 | 3.09% | 2018-01-01T00:00:00Z |
| 1983 | 20,532,688 | 3.09% | 2018-01-01T00:00:00Z |
| 1984 | 21,183,696 | 3.07% | 2018-01-01T00:00:00Z |
| 1985 | 21,849,853 | 3.05% | 2018-01-01T00:00:00Z |
| 1986 | 22,527,517 | 3.01% | 2018-01-01T00:00:00Z |
| 1987 | 23,218,477 | 2.98% | 2018-01-01T00:00:00Z |
| 1988 | 23,933,171 | 2.99% | 2018-01-01T00:00:00Z |
| 1989 | 24,685,791 | 3.05% | 2018-01-01T00:00:00Z |
| 1990 | 25,484,814 | 3.14% | 2018-01-01T00:00:00Z |
| 1991 | 26,337,403 | 3.24% | 2018-01-01T00:00:00Z |
| 1992 | 27,236,099 | 3.3% | 2018-01-01T00:00:00Z |
| 1993 | 28,157,055 | 3.27% | 2018-01-01T00:00:00Z |
| 1994 | 29,067,333 | 3.13% | 2018-01-01T00:00:00Z |
| 1995 | 29,944,302 | 2.93% | 2018-01-01T00:00:00Z |
| 1996 | 30,780,453 | 2.72% | 2018-01-01T00:00:00Z |
| 1997 | 31,586,039 | 2.55% | 2018-01-01T00:00:00Z |
| 1998 | 32,378,333 | 2.45% | 2018-01-01T00:00:00Z |
| 1999 | 33,183,093 | 2.43% | 2018-01-01T00:00:00Z |
| 2000 | 34,020,512 | 2.46% | 2018-01-01T00:00:00Z |
| 2001 | 34,895,398 | 2.51% | 2018-01-01T00:00:00Z |
| 2002 | 35,806,497 | 2.54% | 2018-01-01T00:00:00Z |
| 2003 | 36,760,831 | 2.6% | 2018-01-01T00:00:00Z |
| 2004 | 37,765,139 | 2.66% | 2018-01-01T00:00:00Z |
| 2005 | 38,824,384 | 2.73% | 2018-01-01T00:00:00Z |
| 2006 | 39,942,347 | 2.8% | 2018-01-01T00:00:00Z |
| 2007 | 41,119,693 | 2.86% | 2018-01-01T00:00:00Z |
| 2008 | 42,353,790 | 2.91% | 2018-01-01T00:00:00Z |
| 2009 | 43,639,752 | 2.95% | 2018-01-01T00:00:00Z |
| 2010 | 44,973,330 | 2.97% | 2018-01-01T00:00:00Z |
| 2011 | 46,354,607 | 2.98% | 2018-01-01T00:00:00Z |
| 2012 | 44,928,923 | -3.17% | 2018-01-01T00:00:00Z |
| 2013 | 49,253,126 | 8.78% | 2018-01-01T00:00:00Z |
| 2014 | 49,959,822 | 1.41% | (Worldbank) |
| 2015 | 51,482,633 | 2.96% | (Worldbank) |
| 2016 | 53,050,790 | 2.96% | (Worldbank) |
| 2017 | 57,310,019 | 7.43% | 2018-01-01T00:00:00Z |
| 2018 | 56,318,348 | -1.76% | (Worldbank) |
| 2019 | 58,005,463 | 2.91% | (Worldbank) |
| 2026 | 68,153,004 | 14.89% |
Map & Images (more maps)
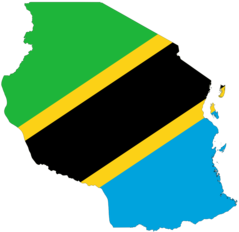
Tanzania Flag Map
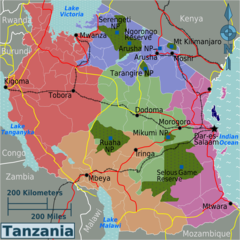
Tanzania Regions Map
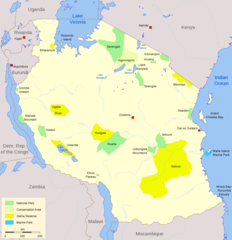
Parks Tanzania Map
Tanzania Map
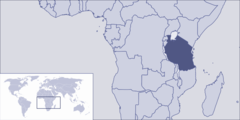
Where Is Tanzania Located
Tanzania
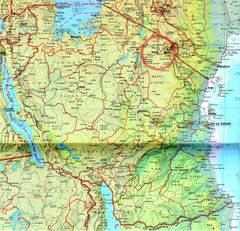
Tanzania Detailed Map
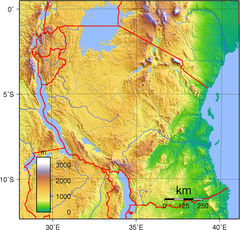
Tanzania Physical
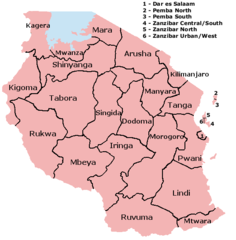
Regions of Tanzania
Spice Islands (tanzania)
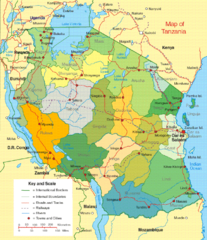
Tanzania Political Map
Tanzania Zanzibar Map