Burundi (Republic of Burundi), BI
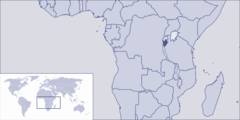
Burundi: This East African country is landlocked and characterized by its hilly terrain and location within the Great Rift Valley.
About

Country Snapshot
Republic of Burundi at a glance
Republic of Burundi currently has 14 quality-checked populated place pages and 16 state or regional pages linked on MapSof.
Mapped cities & towns
14
These counts use a stricter populated-place filter so the main lists stay focused on real city and town pages.
States & regions
16
Open related pagesLargest city
BujumburaPopulation 658,859
Top linked places
Quick Facts about Republic of Burundi
| Population | 12,332,788 |
| Country | Burundi |
| Plate code | RU |
| Area | 27834 km2 |
| Official name | République du Burundi, Uburundi |
| Continent | Africa |
| Easternmost point | Point(30.85 -2.98) |
| Northernmost point | Point(30.4 -2.32) |
| Latitude & Longitude | -3.5000,30.0000 |
| Legislative body | Parliament of Burundi |
| Named for | Kirundi |
| Official language | English, Kirundi, French |
| Capital | Gitega, Bujumbura |
| Establishment | July 01, 1962 (64 years ago) |
| Time Zone | UTC+02:00 |
| Local time | 04:59:19 (21st July 2026) |

Geography
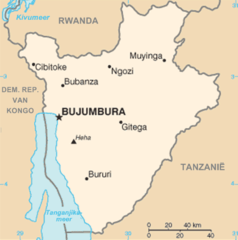
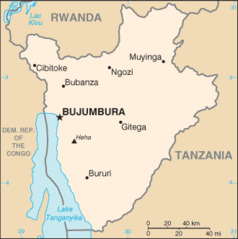
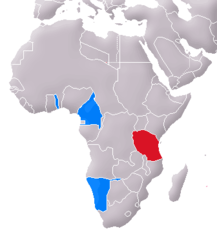
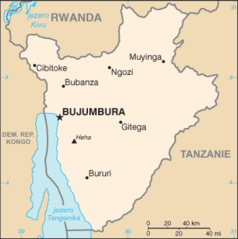
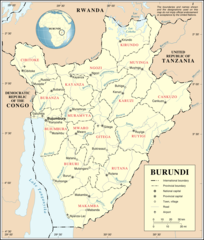
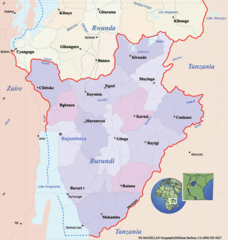
Republic of Burundi is located at 3°30'0"S 30°0'0"E (-3.5000000, 30.0000000). It has 3 neighbors: Rwanda, Tanzania and Congo Kinshasa.
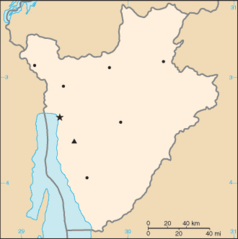
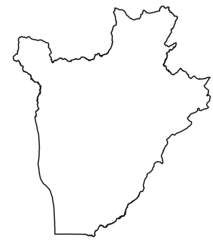
Burundi map
The largest city of Republic of Burundi is Muyinga with a population of 71,076. Other cities include, Gitega population 41,000, Ngozi population 21,506, Rutana population 20,893 and Bururi population 19,740. See all Republic of Burundi cities & populated places.
Compare Republic of Burundi with
- Kayanza Province
- Bubanza Province
- Mwaro Province
- Ruyigi Province
- Makamba Province
- Kirundo Province
- Bururi Province
- Ngozi Province
- Muyinga Province
- Cankuzo Province
- Muramvya Province
- Gitega Province
- Bujumbura Mairie Province
- Bujumbura Rural Province
- Rutana Province
- Cibitoke Province
- Karuzi Province
Demographics
| Year | Population | % Change | Method |
|---|---|---|---|
| 1960 | 2,786,740 | - | census |
| 1961 | 2,840,375 | 1.89% | census |
| 1962 | 2,894,510 | 1.87% | census |
| 1963 | 2,950,903 | 1.91% | census |
| 1964 | 3,011,957 | 2.03% | census |
| 1965 | 3,079,034 | 2.18% | census |
| 1966 | 3,153,879 | 2.37% | census |
| 1967 | 3,235,125 | 2.51% | census |
| 1968 | 3,317,315 | 2.48% | census |
| 1969 | 3,392,949 | 2.23% | census |
| 1970 | 3,457,113 | 1.86% | census |
| 1971 | 3,507,593 | 1.44% | census |
| 1972 | 3,547,335 | 1.12% | census |
| 1973 | 3,582,950 | 0.99% | census |
| 1974 | 3,623,852 | 1.13% | census |
| 1975 | 3,676,991 | 1.45% | census |
| 1976 | 3,744,678 | 1.81% | census |
| 1977 | 3,825,426 | 2.11% | census |
| 1978 | 3,917,774 | 2.36% | census |
| 1979 | 4,018,846 | 2.51% | census |
| 1980 | 4,126,538 | 2.61% | census |
| 1981 | 4,239,795 | 2.67% | census |
| 1982 | 4,359,379 | 2.74% | census |
| 1983 | 4,486,938 | 2.84% | census |
| 1984 | 4,624,850 | 2.98% | census |
| 1985 | 4,774,155 | 3.13% | census |
| 1986 | 4,935,642 | 3.27% | census |
| 1987 | 5,106,707 | 3.35% | census |
| 1988 | 5,280,833 | 3.3% | census |
| 1989 | 5,449,339 | 3.09% | census |
| 1990 | 5,605,873 | 2.79% | census |
| 1991 | 5,749,774 | 2.5% | census |
| 1992 | 5,882,679 | 2.26% | census |
| 1993 | 6,003,704 | 2.02% | census |
| 1994 | 6,112,449 | 1.78% | census |
| 1995 | 6,209,923 | 1.57% | census |
| 1996 | 6,294,482 | 1.34% | census |
| 1997 | 6,369,573 | 1.18% | census |
| 1998 | 6,447,672 | 1.21% | census |
| 1999 | 6,545,273 | 1.49% | census |
| 2000 | 6,674,286 | 1.93% | census |
| 2001 | 6,839,376 | 2.41% | census |
| 2002 | 7,037,727 | 2.82% | census |
| 2003 | 7,264,340 | 3.12% | census |
| 2004 | 7,510,771 | 3.28% | census |
| 2005 | 7,770,392 | 3.34% | census |
| 2006 | 8,042,579 | 3.38% | census |
| 2007 | 8,328,312 | 3.43% | census |
| 2008 | 8,053,574 | -3.41% | census |
| 2009 | 8,926,687 | 9.78% | census |
| 2010 | 9,232,753 | 3.32% | census |
| 2011 | 9,540,362 | 3.22% | census |
| 2012 | 9,849,569 | 3.14% | census |
| 2013 | 10,162,532 | 3.08% | census |
| 2014 | 9,844,297 | -3.23% | (Worldbank) |
| 2015 | 10,160,030 | 3.11% | (Worldbank) |
| 2016 | 10,487,998 | 3.13% | (Worldbank) |
| 2017 | 10,864,245 | 3.46% | census |
| 2018 | 11,175,378 | 2.78% | (Worldbank) |
| 2019 | 11,530,580 | 3.08% | (Worldbank) |
| 2026 | 12,332,788 | 6.5% |
Map & Images (more maps)
000 Burundi Harta
Bujumbura 29 36607e 3 37443s
Burundi 29 94735e 3 34327s
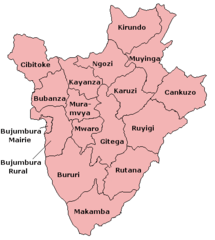
Burundi Provinces
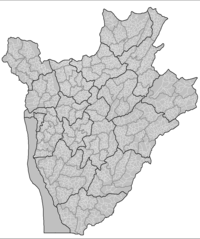
Burundi Collines
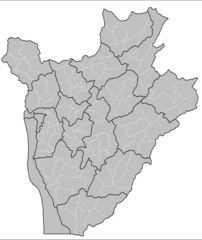
Burundi Communes
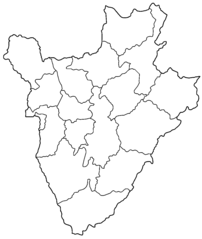
Burundi Provinces Blank
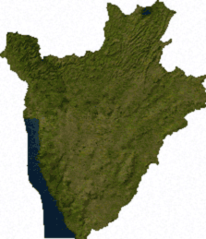
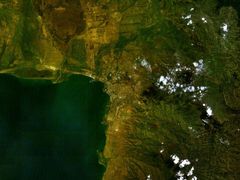
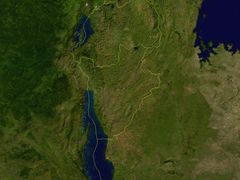
Burundi Sat
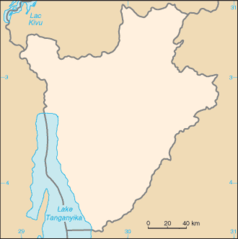
Burundi Map Blank
Burundikaart
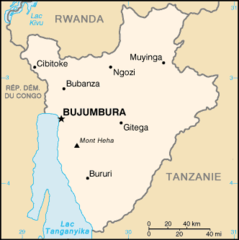
By Map Fr
By Map
Deutschen Kolonie Afrika Deutsch Ostafrika 1
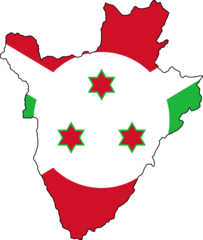
Flag Map of Burundi
Mapa Burundi
Svg Koort Burundi
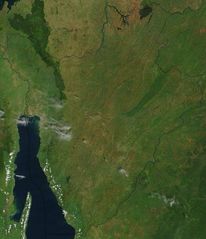
Satellite Image of Burundi In February 2003
Un Burundi
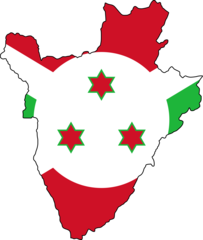
Burundi Flag Map
Burundi Political Map