Comoros (Union of the Comoros), KM
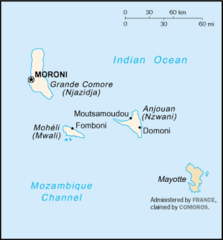
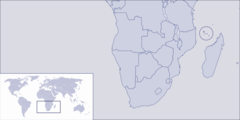
Comoros: This East African nation is an archipelago in the Indian Ocean, located off the southeastern coast of Africa, east of Mozambique and northwest of Madagascar.
About

Country Snapshot
Union of the Comoros at a glance
Union of the Comoros currently has 55 quality-checked populated place pages and 3 state or regional pages linked on MapSof.
Mapped cities & towns
55
These counts use a stricter populated-place filter so the main lists stay focused on real city and town pages.
States & regions
3
Open related pagesLargest city
MoroniPopulation 42,872
Top linked places
Quick Facts about Union of the Comoros
| Population | 919,901 |
| Country | Comoros |
| Area | 2034 km2 |
| Official name | l’Union des Comores, Comores |
| Continent | Africa |
| Easternmost point | Point(44.540611111 -12.260527777) |
| Northernmost point | Point(43.35 -11.37) |
| Latitude & Longitude | -12.2333,44.4455 |
| Legislative body | Assembly of the Union of the Comoros |
| Official language | Comorian, Arabic, French |
| Capital | Moroni |
| Establishment | January 01, 2001 (25 years ago) |
| Time Zone | UTC+03:00 |
| Local time | 13:16:10 (27th June 2026) |

Geography
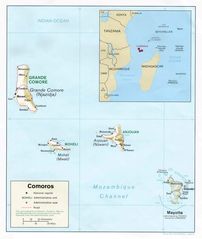
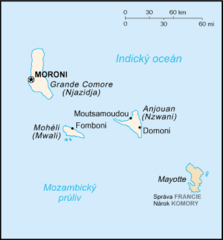
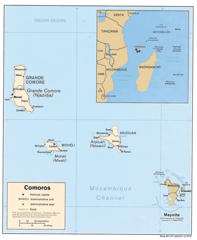
Union of the Comoros is located at 12°13'60"S 44°26'44"E (-12.2333300, 44.4455300). It has 5 neighbors: Tanzania, Seychelles, Mozambique, Madagascar and France.
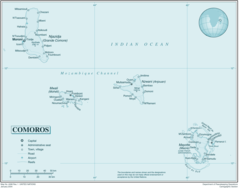
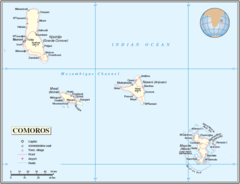
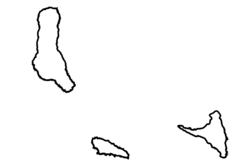
Comoros map
The largest city of Union of the Comoros is Moroni with a population of 42,872. Other cities include, Dembéni population 4,133 and Nioumachoua population 3,412. See all Union of the Comoros cities & populated places.
Compare Union of the Comoros with
- Grande Comore
- Anjouan
- Mohéli
Demographics
| Year | Population | % Change | Method |
|---|---|---|---|
| 1960 | 191,121 | - | (Worldbank) |
| 1961 | 194,139 | 1.55% | (Worldbank) |
| 1962 | 197,198 | 1.55% | (Worldbank) |
| 1963 | 200,372 | 1.58% | (Worldbank) |
| 1964 | 203,753 | 1.66% | (Worldbank) |
| 1965 | 207,424 | 1.77% | (Worldbank) |
| 1966 | 211,478 | 1.92% | (Worldbank) |
| 1967 | 215,897 | 2.05% | (Worldbank) |
| 1968 | 220,575 | 2.12% | (Worldbank) |
| 1969 | 225,325 | 2.11% | (Worldbank) |
| 1970 | 230,054 | 2.06% | (Worldbank) |
| 1971 | 234,644 | 1.96% | (Worldbank) |
| 1972 | 239,235 | 1.92% | (Worldbank) |
| 1973 | 244,208 | 2.04% | (Worldbank) |
| 1974 | 250,104 | 2.36% | (Worldbank) |
| 1975 | 257,290 | 2.79% | (Worldbank) |
| 1976 | 265,953 | 3.26% | (Worldbank) |
| 1977 | 275,900 | 3.61% | (Worldbank) |
| 1978 | 286,634 | 3.74% | (Worldbank) |
| 1979 | 297,447 | 3.64% | (Worldbank) |
| 1980 | 307,829 | 3.37% | (Worldbank) |
| 1981 | 317,606 | 3.08% | (Worldbank) |
| 1982 | 326,946 | 2.86% | (Worldbank) |
| 1983 | 336,096 | 2.72% | (Worldbank) |
| 1984 | 345,466 | 2.71% | (Worldbank) |
| 1985 | 355,337 | 2.78% | (Worldbank) |
| 1986 | 365,760 | 2.85% | (Worldbank) |
| 1987 | 376,654 | 2.89% | (Worldbank) |
| 1988 | 387,963 | 2.91% | (Worldbank) |
| 1989 | 399,632 | 2.92% | (Worldbank) |
| 1990 | 411,594 | 2.91% | (Worldbank) |
| 1991 | 423,872 | 2.9% | (Worldbank) |
| 1992 | 436,448 | 2.88% | (Worldbank) |
| 1993 | 449,274 | 2.85% | (Worldbank) |
| 1994 | 462,277 | 2.81% | (Worldbank) |
| 1995 | 475,394 | 2.76% | (Worldbank) |
| 1996 | 488,627 | 2.71% | (Worldbank) |
| 1997 | 501,953 | 2.65% | (Worldbank) |
| 1998 | 515,385 | 2.61% | (Worldbank) |
| 1999 | 528,848 | 2.55% | (Worldbank) |
| 2000 | 542,357 | 2.49% | (Worldbank) |
| 2001 | 541,976 | -0.07% | estimation process |
| 2002 | 556,028 | 2.53% | estimation process |
| 2003 | 570,491 | 2.54% | estimation process |
| 2004 | 585,389 | 2.54% | estimation process |
| 2005 | 600,733 | 2.55% | estimation process |
| 2006 | 616,526 | 2.56% | estimation process |
| 2007 | 632,736 | 2.56% | estimation process |
| 2008 | 649,291 | 2.55% | estimation process |
| 2009 | 666,097 | 2.52% | estimation process |
| 2010 | 683,081 | 2.49% | estimation process |
| 2011 | 700,216 | 2.45% | estimation process |
| 2012 | 717,503 | 2.41% | estimation process |
| 2013 | 734,917 | 2.37% | estimation process |
| 2014 | 759,390 | 3.22% | (Worldbank) |
| 2015 | 777,424 | 2.32% | (Worldbank) |
| 2016 | 795,592 | 2.28% | (Worldbank) |
| 2017 | 823,652 | 3.41% | estimation process |
| 2018 | 832,322 | 1.04% | (Worldbank) |
| 2019 | 850,886 | 2.18% | (Worldbank) |
| 2026 | 919,901 | 7.5% |
Map & Images (more maps)
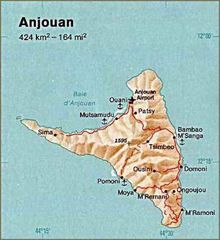
Anjouan (comoros) Map

Comoros 506px
Comoros Mayotte
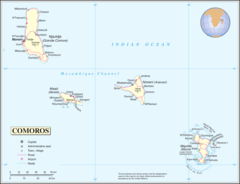
Comoros Rel91
Comoros Cia Wfb Map
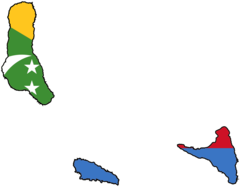
Flag Map of the Comoros
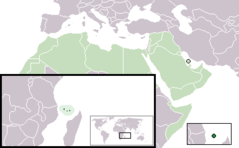
Location Comoros Aw
Mapa Komor
Svg Koort Komoren
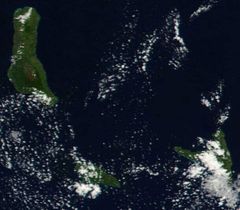
Satellite Image of Comoros In April 2002
Un Comoros
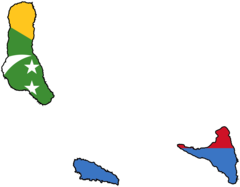
Comoros Flag Map
Comoros Map
Where Is Comoros Located