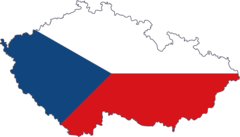
Czech Republic (Czechia), CZ
Czech Republic: Located in Central Europe, this landlocked nation is known for its rich history, diverse architecture, and vibrant culture.
About

Country Snapshot
Czechia at a glance
Czechia currently has 1,105 quality-checked populated place pages and 14 state or regional pages linked on MapSof.
Mapped cities & towns
1,105
These counts use a stricter populated-place filter so the main lists stay focused on real city and town pages.
States & regions
14
Open related pagesLargest city
PraguePopulation 1,267,449
Top linked places
Quick Facts about Czechia
| Population | 10,882,341 |
| Country | Czech Republic |
| Plate code | CZ |
| Area | 78866 km2 |
| Official name | Česká republika, la République tchèque |
| Has part | Czech Silesia, Moravia, Czech part of Lower Austria, Bohemia |
| Water as percent of area | 2% |
| Land as percent of area | 98% |
| Continent | Europe |
| Easternmost point | Point(18.85908365 49.55060726) |
| Northernmost point | Point(14.3156 51.0557) |
| Latitude & Longitude | 49.7500,15.0000 |
| Legislative body | Parliament of the Czech Republic |
| Named for | Czechs |
| Official language | Czech |
| Altitude | 1,411 feet / 430 meters |
| Capital | Prague |
| Establishment | January 01, 1993 (33 years ago) |
| Time Zone | Europe/Prague, Central European Time, Central European Summer Time, UTC+01:00, UTC+02:00 |
| Local time | 14:41:33 (16th July 2026) |

Geography
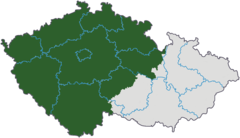
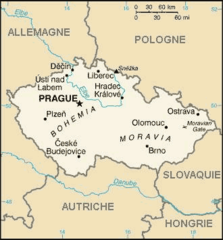
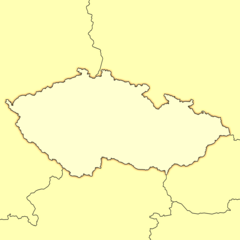
Czechia is located at 49°45'0"N 15°0'0"E (49.7500000, 15.0000000). It has 5 neighbors: Poland, Austria, Germany, Slovakia and Union.
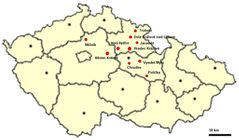
Czech Republic map
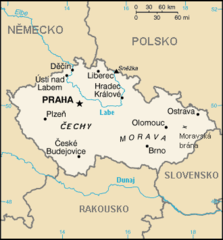
The largest city of Czechia is Prague with a population of 1,267,449. Other cities include, Brno population 377,028, Ostrava population 292,681, Olomouc population 100,154 and České Budějovice population 97,243. See all Czechia cities & populated places.
Official website of Czechia
Official WebsiteCompare Czechia with
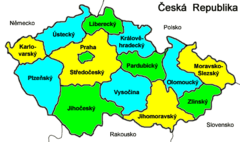
- Prague
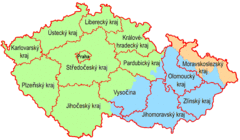
- Hradec Králové Region
- Vysočina Region
- Liberec Region
- South Moravian Region
- South Bohemian Region
- Plzeň Region
- Olomouc Region
- Karlovy Vary Region
- Zlín Region
- Ústí nad Labem Region
- Moravian-Silesian Region
- Central Bohemian Region
- Pardubice Region
Demographics
| Year | Population | % Change | Method |
|---|---|---|---|
| 1960 | 9,602,006 | - | (Worldbank) |
| 1961 | 9,586,651 | -0.16% | (Worldbank) |
| 1962 | 9,624,660 | 0.39% | (Worldbank) |
| 1963 | 9,670,685 | 0.48% | (Worldbank) |
| 1964 | 9,727,804 | 0.59% | (Worldbank) |
| 1965 | 9,779,358 | 0.53% | (Worldbank) |
| 1966 | 9,821,040 | 0.42% | (Worldbank) |
| 1967 | 9,852,899 | 0.32% | (Worldbank) |
| 1968 | 9,876,346 | 0.24% | (Worldbank) |
| 1969 | 9,896,580 | 0.2% | (Worldbank) |
| 1970 | 9,858,071 | -0.39% | (Worldbank) |
| 1971 | 9,826,815 | -0.32% | (Worldbank) |
| 1972 | 9,867,632 | 0.41% | (Worldbank) |
| 1973 | 9,922,266 | 0.55% | (Worldbank) |
| 1974 | 9,988,459 | 0.66% | (Worldbank) |
| 1975 | 10,058,620 | 0.7% | (Worldbank) |
| 1976 | 10,125,939 | 0.66% | (Worldbank) |
| 1977 | 10,186,755 | 0.6% | (Worldbank) |
| 1978 | 10,242,098 | 0.54% | (Worldbank) |
| 1979 | 10,292,341 | 0.49% | (Worldbank) |
| 1980 | 10,304,193 | 0.12% | (Worldbank) |
| 1981 | 10,300,591 | -0.03% | (Worldbank) |
| 1982 | 10,314,826 | 0.14% | (Worldbank) |
| 1983 | 10,323,856 | 0.09% | (Worldbank) |
| 1984 | 10,330,213 | 0.06% | (Worldbank) |
| 1985 | 10,337,118 | 0.07% | (Worldbank) |
| 1986 | 10,342,227 | 0.05% | (Worldbank) |
| 1987 | 10,347,318 | 0.05% | (Worldbank) |
| 1988 | 10,355,276 | 0.08% | (Worldbank) |
| 1989 | 10,361,068 | 0.06% | (Worldbank) |
| 1990 | 10,333,355 | -0.27% | (Worldbank) |
| 1991 | 10,308,578 | -0.24% | (Worldbank) |
| 1992 | 10,317,807 | 0.09% | census |
| 1993 | 10,330,607 | 0.12% | census |
| 1994 | 10,333,587 | 0.03% | (Worldbank) |
| 1995 | 10,330,759 | -0.03% | 1705-01-01T00:00:00Z |
| 1996 | 10,315,241 | -0.15% | (Worldbank) |
| 1997 | 10,304,131 | -0.11% | (Worldbank) |
| 1998 | 10,294,373 | -0.09% | (Worldbank) |
| 1999 | 10,283,860 | -0.1% | (Worldbank) |
| 2000 | 10,272,503 | -0.11% | census |
| 2001 | 10,216,605 | -0.55% | (Worldbank) |
| 2002 | 10,196,916 | -0.19% | (Worldbank) |
| 2003 | 10,193,998 | -0.03% | (Worldbank) |
| 2004 | 10,197,101 | 0.03% | (Worldbank) |
| 2005 | 10,234,092 | 0.36% | census |
| 2006 | 10,238,905 | 0.05% | (Worldbank) |
| 2007 | 10,298,828 | 0.58% | (Worldbank) |
| 2008 | 10,384,603 | 0.83% | (Worldbank) |
| 2009 | 10,443,936 | 0.57% | (Worldbank) |
| 2010 | 10,693,939 | 2.34% | 5421943 |
| 2011 | 10,436,560 | -2.47% | census |
| 2012 | 10,509,286 | 0.69% | 1860-01-01T00:00:00Z |
| 2013 | 10,521,646 | 0.12% | 1990-01-01T00:00:00Z |
| 2014 | 10,525,347 | 0.04% | (Worldbank) |
| 2015 | 10,538,275 | 0.12% | census |
| 2016 | 10,553,843 | 0.15% | 1860-01-01T00:00:00Z |
| 2017 | 10,594,438 | 0.38% | (Worldbank) |
| 2018 | 10,629,928 | 0.33% | (Worldbank) |
| 2019 | 10,669,709 | 0.37% | (Worldbank) |
| 2026 | 10,882,341 | 1.95% |
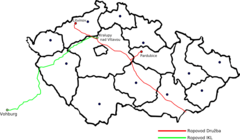
Map & Images (more maps)
Location of Dowry Towns In the Czech Republic
Aussig 1936 Iv
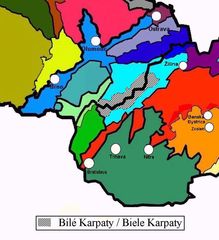
Biele Karpaty
Boh Map
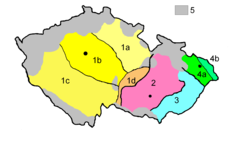
Cz Cechy Morava Kraje

Cz Cleneni Cechy Wl
Cz Cleneni Slezsko Wl
Cz Mapa With Czech Description
Cz Mapa
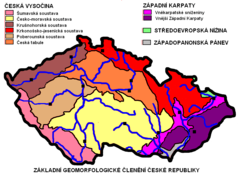
Cze Geomorf
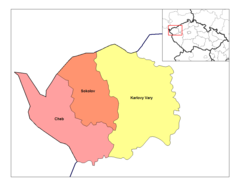
Carlsbad Districts
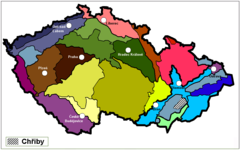
Chriby
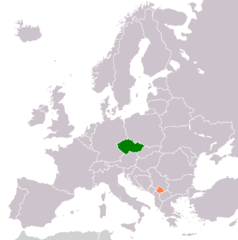
Czech Republic Kosovo Locator 2
Czech Republic Map Modern
Czech Republic Stub
Czech Dialects
Czech Pipelines
Czechbeerse
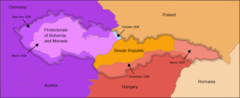
Czechoslovakia 1939he 2
Czechy Kraje