Albania (Republic of Albania), AL
Albania: Located in Southeastern Europe, this country on the Balkan Peninsula is known for its rugged mountains, beautiful coastlines along the Adriatic and Ionian Seas, and a rich historical heritage influenced by various civilizations.
About

Country Snapshot
Republic of Albania at a glance
Republic of Albania currently has 48 quality-checked populated place pages and 12 state or regional pages linked on MapSof.
Mapped cities & towns
48
These counts use a stricter populated-place filter so the main lists stay focused on real city and town pages.
States & regions
12
Open related pagesLargest city
TiranaPopulation 374,801
Top linked places
Quick Facts about Republic of Albania
| Population | 2,363,314 |
| Country | Albania |
| Plate code | AL |
| Area | 28748 km2 |
| Official name | Republika e Shqipërisë, la République d’Albanie, Αλβανία |
| Water as percent of area | 5.7% |
| Land as percent of area | 94.3% |
| Continent | Europe |
| Easternmost point | Point(21.0571754 40.66620273) |
| Northernmost point | Point(19.73 42.67) |
| Latitude & Longitude | 41.0000,20.0000 |
| Legislative body | Parliament of Albania |
| Official language | Albanian |
| Capital | Tirana |
| Establishment | November 28, 1912 (113 years ago) |
| Time Zone | UTC+01:00, UTC+02:00, Europe/Tirane, Central European Time |
| Local time | 04:19:25 (17th July 2026) |

Geography
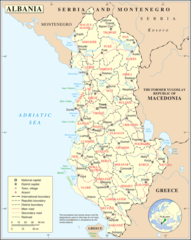
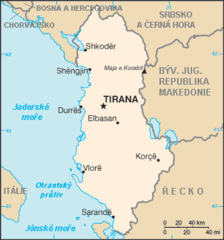
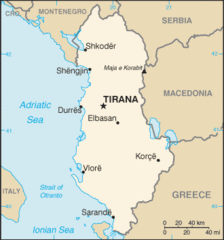
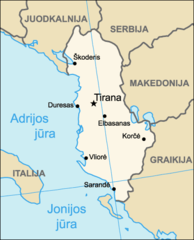
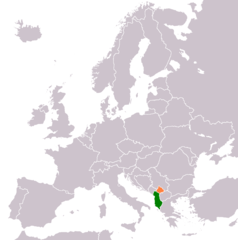
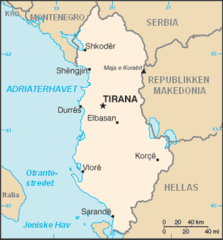
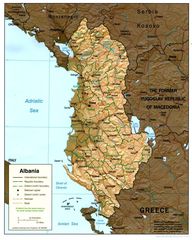
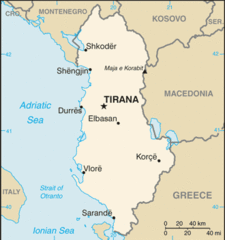
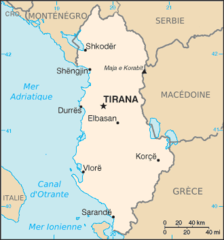
Republic of Albania is located at 41°0'0"N 20°0'0"E (41.0000000, 20.0000000). It has 6 neighbors: Greece, North Macedonia, Montenegro, Union, Serbia and Kosovo.
Albania map
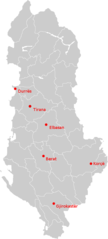
The largest city of Republic of Albania is Tirana with a population of 374,801. Other cities include, Vlorë population 130,827, Kamëz population 126,777, Durrës population 122,034 and Elbasan population 100,903. See all Republic of Albania cities & populated places.
Compare Republic of Albania with
- Tirana County
- Korçë County
- Berat County
- Elbasan County
- Kukës County
- Lezhë County
- Gjirokastër County
- Fier County
- Dibër County
- Durrës County
- Shkodër County
- Vlorë County
Demographics
| Year | Population | % Change | Method |
|---|---|---|---|
| 1960 | 1,608,800 | - | estimation process |
| 1961 | 1,659,800 | 3.07% | estimation process |
| 1962 | 1,711,319 | 3.01% | estimation process |
| 1963 | 1,762,621 | 2.91% | estimation process |
| 1964 | 1,814,135 | 2.84% | estimation process |
| 1965 | 1,864,791 | 2.72% | estimation process |
| 1966 | 1,914,573 | 2.6% | estimation process |
| 1967 | 1,965,598 | 2.6% | estimation process |
| 1968 | 2,022,272 | 2.8% | estimation process |
| 1969 | 2,081,695 | 2.85% | estimation process |
| 1970 | 2,135,479 | 2.52% | estimation process |
| 1971 | 2,187,853 | 2.39% | estimation process |
| 1972 | 2,243,126 | 2.46% | estimation process |
| 1973 | 2,296,752 | 2.33% | estimation process |
| 1974 | 2,350,124 | 2.27% | estimation process |
| 1975 | 2,404,831 | 2.27% | estimation process |
| 1976 | 2,458,526 | 2.18% | estimation process |
| 1977 | 2,513,546 | 2.19% | estimation process |
| 1978 | 2,566,266 | 2.05% | estimation process |
| 1979 | 2,617,832 | 1.97% | estimation process |
| 1980 | 2,671,997 | 2.03% | census |
| 1981 | 2,726,056 | 1.98% | estimation process |
| 1982 | 2,784,278 | 2.09% | estimation process |
| 1983 | 2,843,960 | 2.1% | estimation process |
| 1984 | 2,904,429 | 2.08% | estimation process |
| 1985 | 2,964,762 | 2.04% | census |
| 1986 | 3,022,635 | 1.91% | estimation process |
| 1987 | 3,083,605 | 1.98% | estimation process |
| 1988 | 3,142,336 | 1.87% | estimation process |
| 1989 | 3,227,943 | 2.65% | estimation process |
| 1990 | 3,286,542 | 1.78% | estimation process |
| 1991 | 3,266,790 | -0.6% | estimation process |
| 1992 | 3,247,039 | -0.61% | estimation process |
| 1993 | 3,227,287 | -0.61% | estimation process |
| 1994 | 3,207,536 | -0.62% | estimation process |
| 1995 | 3,187,784 | -0.62% | census |
| 1996 | 3,168,033 | -0.62% | estimation process |
| 1997 | 3,148,281 | -0.63% | estimation process |
| 1998 | 3,128,530 | -0.63% | estimation process |
| 1999 | 3,108,778 | -0.64% | census |
| 2000 | 3,089,027 | -0.64% | estimation process |
| 2001 | 3,060,173 | -0.94% | census |
| 2002 | 3,051,010 | -0.3% | estimation process |
| 2003 | 3,039,616 | -0.37% | estimation process |
| 2004 | 3,026,939 | -0.42% | estimation process |
| 2005 | 3,011,487 | -0.51% | estimation process |
| 2006 | 2,992,547 | -0.63% | estimation process |
| 2007 | 2,970,017 | -0.76% | estimation process |
| 2008 | 2,947,314 | -0.77% | estimation process |
| 2009 | 2,927,519 | -0.68% | estimation process |
| 2010 | 2,913,021 | -0.5% | estimation process |
| 2011 | 2,905,195 | -0.27% | census |
| 2012 | 2,900,401 | -0.17% | estimation process |
| 2013 | 2,895,092 | -0.18% | estimation process |
| 2014 | 2,889,104 | -0.21% | estimation process |
| 2015 | 2,880,703 | -0.29% | |
| 2016 | 2,876,101 | -0.16% | |
| 2017 | 2,873,457 | -0.09% | estimation process |
| 2018 | 2,866,376 | -0.25% | |
| 2019 | 2,854,191 | -0.43% | |
| 2026 | 2,363,314 | -20.77% |
Other places with the same name (2)
- Albania, La Guajira with a population of 6,364 people.
- Albania, Caquetá with a population of 4,160 people.
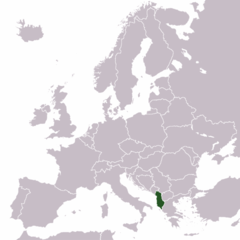
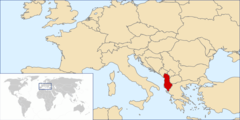
Map & Images (more maps)
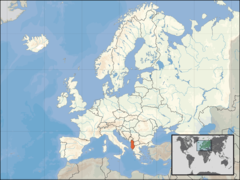
Europe Location Al
Locationofalbania
Al Mapa
Al Map
Albania (lithuania)
Albania Kosovo Locator 2
Albania Orthodox Diocese
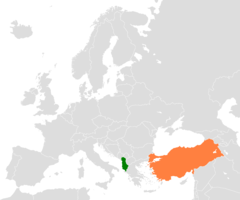
Albania Turkey Locator
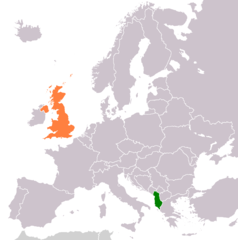
Albania United Kingdom Locator
Albania Map No
Albania Relief

Albania Cia Wfb Map
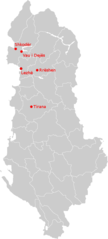
Albania Map
Albanian Embassies
Albanie Carte
Ethnic Albania
Europe Location Alb
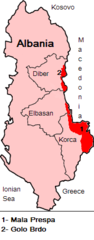
Malaprespaigolobrdo
Roman Catholic Diocese In Albania
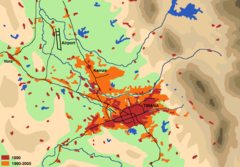
Tirana Expansion