Switzerland (Swiss Confederation), CH
Switzerland: Located in the heart of Europe, this mountainous country is known for its neutrality, direct democracy, and diverse culture.
About

Country Snapshot
Swiss Confederation at a glance
Swiss Confederation currently has 752 quality-checked populated place pages and 26 state or regional pages linked on MapSof.
Mapped cities & towns
752
These counts use a stricter populated-place filter so the main lists stay focused on real city and town pages.
States & regions
26
Open related pagesLargest city
ZürichPopulation 434,008
Top linked places
Quick Facts about Swiss Confederation
| Population | 9,082,848 |
| Country | Switzerland |
| Different from | Switzerland County |
| Twitter username | MySwitzerland_e, Suisse |
| Plate code | CH |
| Area | 41285 km2 |
| Official name | Confédération suisse, Schweizerische Eidgenossenschaft, la Confédération suisse, Confederaziun svizra, Confederazione svizzera, Confoederatio Helvetica |
| Continent | Europe |
| Easternmost point | Point(10.49234033 46.6151637) |
| Northernmost point | Point(8.57 47.8) |
| Latitude & Longitude | 47.0002,8.0143 |
| Legislative body | Federal Assembly of Switzerland |
| Named for | Schwyz |
| Official language | German, Italian, French, Romansh |
| Capital | Bern |
| Time Zone | Europe/Zurich, Central European Time, UTC+02:00, UTC+01:00 |
| Local time | 19:46:56 (14th July 2026) |

Geography
Swiss Confederation is located at 47°0'1"N 8°0'51"E (47.0001583752864, 8.01426887512207). It has 6 neighbors: Austria, Germany, France, Liechtenstein, Italy and Union.
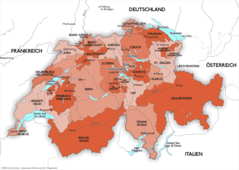
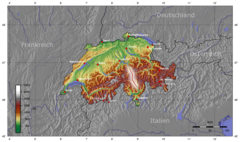
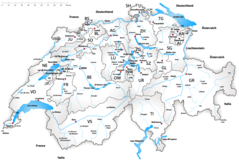
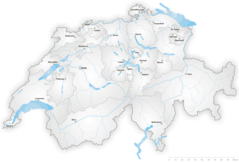
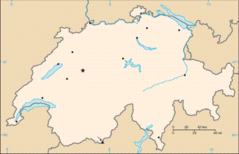
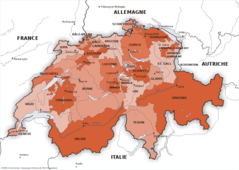
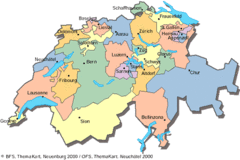
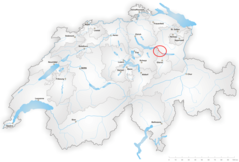
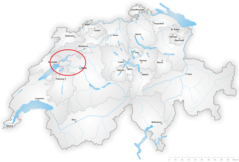
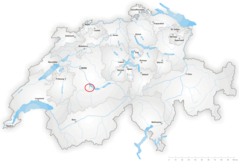
Switzerland map
The largest city of Swiss Confederation is Genève with a population of 201,818. Other cities include, Basel population 177,636, Bern population 133,883, Winterthur population 111,840 and Luzern population 81,691. See all Swiss Confederation cities & populated places.
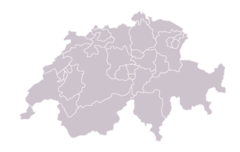
Compare Swiss Confederation with
- Canton of Zug
- Canton of Schaffhausen
- Schwyz
- Obwalden
- Canton of St. Gallen
- Canton of Jura
- Thurgau
- Basel-Stadt
- Uri
- Grisons
- Canton of Neuchâtel
- Nidwalden
- Appenzell Ausserrhoden
- Aargau
- Ticino
- Canton of Geneva
- Canton of Solothurn
- Appenzell Innerrhoden
- Canton of Lucerne
- Canton of Valais
- Canton of Zürich
- Basel-Landschaft
- Canton of Bern
- Canton of Vaud
- Glarus
- Canton of Fribourg
Demographics
| Year | Population | % Change | Method |
|---|---|---|---|
| 1960 | 5,327,827 | - | census |
| 1961 | 5,434,294 | 1.96% | census |
| 1962 | 5,573,815 | 2.5% | census |
| 1963 | 5,694,247 | 2.11% | census |
| 1964 | 5,789,228 | 1.64% | census |
| 1965 | 5,856,472 | 1.15% | census |
| 1966 | 5,918,002 | 1.04% | census |
| 1967 | 5,991,785 | 1.23% | census |
| 1968 | 6,067,714 | 1.25% | census |
| 1969 | 6,136,387 | 1.12% | census |
| 1970 | 6,180,877 | 0.72% | census |
| 1971 | 6,213,399 | 0.52% | census |
| 1972 | 6,260,956 | 0.76% | census |
| 1973 | 6,307,347 | 0.74% | census |
| 1974 | 6,341,405 | 0.54% | census |
| 1975 | 6,338,632 | -0.04% | census |
| 1976 | 6,302,504 | -0.57% | census |
| 1977 | 6,281,174 | -0.34% | census |
| 1978 | 6,281,738 | 0.01% | census |
| 1979 | 6,294,365 | 0.2% | census |
| 1980 | 6,319,408 | 0.4% | census |
| 1981 | 6,354,074 | 0.55% | census |
| 1982 | 6,391,309 | 0.58% | census |
| 1983 | 6,418,773 | 0.43% | census |
| 1984 | 6,441,865 | 0.36% | census |
| 1985 | 6,470,365 | 0.44% | census |
| 1986 | 6,504,124 | 0.52% | census |
| 1987 | 6,545,106 | 0.63% | census |
| 1988 | 6,593,386 | 0.73% | census |
| 1989 | 6,646,912 | 0.81% | census |
| 1990 | 6,715,519 | 1.02% | census |
| 1991 | 6,799,978 | 1.24% | census |
| 1992 | 6,875,364 | 1.1% | census |
| 1993 | 6,938,265 | 0.91% | census |
| 1994 | 6,993,795 | 0.79% | census |
| 1995 | 7,040,687 | 0.67% | census |
| 1996 | 7,071,850 | 0.44% | census |
| 1997 | 7,088,906 | 0.24% | census |
| 1998 | 7,110,001 | 0.3% | census |
| 1999 | 7,143,991 | 0.48% | census |
| 2000 | 7,184,250 | 0.56% | census |
| 2001 | 7,229,854 | 0.63% | census |
| 2002 | 7,284,753 | 0.75% | census |
| 2003 | 7,339,001 | 0.74% | census |
| 2004 | 7,389,625 | 0.69% | census |
| 2005 | 7,437,115 | 0.64% | census |
| 2006 | 7,483,934 | 0.63% | census |
| 2007 | 7,551,117 | 0.89% | census |
| 2008 | 7,647,675 | 1.26% | census |
| 2009 | 7,743,831 | 1.24% | census |
| 2010 | 7,824,909 | 1.04% | census |
| 2011 | 7,912,398 | 1.11% | census |
| 2012 | 7,996,861 | 1.06% | census |
| 2013 | 8,087,875 | 1.13% | census |
| 2014 | 8,211,700 | 1.51% | census |
| 2015 | 8,282,396 | 0.85% | (Worldbank) |
| 2016 | 8,373,338 | 1.09% | (Worldbank) |
| 2017 | 8,466,017 | 1.09% | census |
| 2018 | 8,514,329 | 0.57% | (Worldbank) |
| 2019 | 8,574,832 | 0.71% | (Worldbank) |
| 2026 | 9,082,848 | 5.59% |
Map & Images (more maps)
Gotthard Basistunnel Trasse
Karte Schweiz Details
Karte Schweiz
000 Zvicra Harta
Blankmap Switzerland
Brunig Napf Reuss Linie
Carte Drapeau Suisse

Cantons of Switzerland, Blank
Carte Suisse2
Ch Map 1
Corrections Eau Linth General
Corrections Eau Jura General
Deviation Kander General
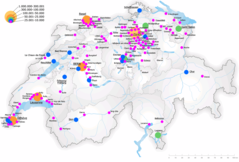
Distrib Citta Svizzera
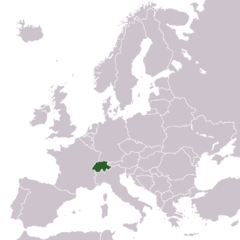
Europe Location Ch
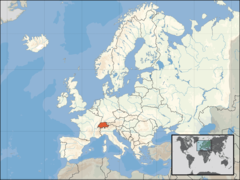
Europe Location Che
Heutige Deutsche Mundarten 2
Historische Karte Ch Fokus Vitudurum
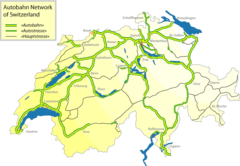
Image Swiss Highway Network En
Karte Schweiz Sprachen