North Chicago, Illinois
North Chicago: city and suburb of Chicago, Illinois, USA
About
North Chicago is a city located in the county of Lake in the U.S. state of Illinois. Its population at the 2010 census was 32,574 and a population density of 1,572 people per km². After 10 years in 2020 city had an estimated population of 29,639 inhabitants.
The city was created 134 years ago in 1891.

Quick Facts about North Chicago
| Population | 29,639 (2020) |
| Country | United States of America |
| State | Illinois (United States) |
| County | Lake County |
| Different from | North Side |
| Phone Area Codes | 847 |
| Area | 20.72 km2 |
| Latitude & Longitude | 42.3256,-87.8412 |
| Altitude | 659 feet / 201 meters |
| Establishment | January 01, 1892 (134 years ago) |
| Time Zone | America/Chicago |
| Local time | 09:12:55 (18th July 2026) |
| Postal code | 60064 |
| Density | 1,430 Pop. per km² as of 2020 |
| Population growth | -9.9% (2010-2020) |
| Weather | 89℉ Slight Chance Rain Showers then Mostly Sunny 7-days weather |
Geography
North Chicago is located at 42°19'32"N 87°50'28"W (42.3255800, -87.8411800).
North Chicago map
Weather
A slight chance of rain showers between 7am and 8am. Mostly sunny. High near 89, with temperatures falling to around 82 in the afternoon. Heat index v...
7-Day ForecastOfficial website of North Chicago
Official WebsiteDemographics
According to census records, the population of North Chicago decreased by 9.9% in 10 years.
| Year | Population | % Change | Method |
|---|---|---|---|
| 2010 | 32,574 | - | census |
| 2011 | 29,822 | -9.23% | estimation process |
| 2012 | 30,126 | 1.01% | estimation process |
| 2013 | 30,452 | 1.07% | estimation process |
| 2014 | 29,659 | -2.67% | estimation process |
| 2015 | 30,060 | 1.33% | estimation process |
| 2016 | 29,939 | -0.4% | estimation process |
| 2017 | 29,953 | 0.05% | estimation process |
| 2018 | 29,763 | -0.64% | estimation process |
| 2019 | 29,615 | -0.5% | estimation process |
| 2020 | 29,639 | 0.08% | estimation process |
Demographic Facts
| Estimated population as of July 1, 2019 : | 5,247 |
| Based on demographic estimates as of April 1, 2010 : | 5,168 |
| Based on demographic estimates as of 1 April 2010 : | 1.5% |
| April 1, 2020 Population : | 5,228 |
| April 1, 2010 Population : | 5,155 |
| People under 5 years old, percentage : | 6.8% |
| People under 18 years old, percentage : | 18.3% |
| People over 65 (%) : | 22.1% |
| Female persons, % : | 46.2% |
| White only, percent : | 87.4% |
| Black or African American alone, percent : | 0.0% |
| American Indian and Alaska Native only, % : | 1.7% |
| Asians alone % : | 1.5% |
| Only Native Hawaiians and Other Pacific Islanders, % : | 0.3% |
| % of people who have participated in two or more races : | 0.6% |
| % of Hispanic or Latino : | 35.9% |
| White people, not Hispanic or Latino people, make up the majority of the population. : | 61.7% |
| 2015-2019 Veterans : | 289 |
| Percentage of foreign-born people, 2015-2019 : | 24.4% |
| Rate of owner-occupied housing units, 2015-2019 : | 60.8% |
Economic Facts
| Rate of owner-occupied housing units, 2015-2019 : | 60.8% |
| Owner-occupied housing unit median value, 2015-2019 : | $570,100 |
| From 2015 to 2019, the median selected monthly owner costs - with a mortgage : | $2,636 |
| Monthly owner costs, without a mortgage, at the median, 2015-2019 : | $700 |
| 2015-2019 median gross rent : | $1,392 |
| 2015-2019 Households : | 2,124 |
| Population per household, 2015-2019 : | 2.45 |
| Living in the same house a year ago, percentage of people aged one year and up, 2015-2019 : | 92.9% |
| Languages other than English spoken at home, as a percentage of people aged 5 and up, 2015-2019 : | 39.5% |
| Households with computers, %, 2015-2019 : | 91.9% |
| Percentage of households with a broadband Internet subscription, 2015-2019 : | 84.9% |
| Percentage of people aged 25 and up with a high school diploma or higher, 2015-2019 : | 86.1% |
| Bachelor's degree or higher, proportion of people aged 25 and up, 2015-2019 : | 32.8% |
| Percentage of people under the age of 65 who have a disability, 2015-2019 : | 11.6% |
| Persons under the age of 65 who do not have health insurance, as a percentage : | 8.1% |
| Total civilian labor force, percent of population aged 16 and up, 2015-2019 : | 63.8% |
| Female labor force participation in the civilian labor force, as a percentage of the population aged 16 and up, 2015-2019 : | 57.9% |
| Total sales of lodging and food services in 2012 ($1,000) : | 54,060 |
| 2012 total retail sales ($1,000) : | 68,572 |
| 2012 total retail sales per capita : | $13,167 |
| Mean commute time to work (in minutes), workers aged 16 and up, 2015-2019 : | 18.7 |
| 2015-2019 median household income (in 2019 dollars) : | $67,119 |
| Income per capita in the previous 12 months (in 2019 dollars), 2015-2019 : | $48,232 |
| Percentage of people living in poverty : | 6.9% |
| Total number of businesses in 2012 : | 662 |
| Men-owned businesses in 2012 : | 358 |
| Women-owned businesses in 2012 : | 221 |
| Minority-owned businesses in 2012 : | 138 |
| Non-minority-owned businesses in 2012 : | 513 |
| Veteran-owned businesses in 2012 : | 114 |
| Nonveteran-owned businesses in 2012 : | 539 |
| 2010 population per square mile : | 1,986.2 |
| 2010 land area in square miles : | 2.60 |
| Rate of owner-occupied housing units, 2015-2019 : | 53.1% |
| Owner-occupied housing unit median value, 2015-2019 : | $107,500 |
| From 2015 to 2019, the median selected monthly owner costs - with a mortgage : | $1,231 |
| Monthly owner costs, without a mortgage, at the median, 2015-2019 : | $511 |
| 2015-2019 median gross rent : | $1,098 |
| 2015-2019 Households : | 1,756 |
| Population per household, 2015-2019 : | 3.16 |
| Living in the same house a year ago, percentage of people aged one year and up, 2015-2019 : | 72.7% |
| Languages other than English spoken at home, as a percentage of people aged 5 and up, 2015-2019 : | 20.3% |
| Households with computers, %, 2015-2019 : | 96.3% |
| Percentage of households with a broadband Internet subscription, 2015-2019 : | 89.0% |
| Percentage of people aged 25 and up with a high school diploma or higher, 2015-2019 : | 86.9% |
| Bachelor's degree or higher, proportion of people aged 25 and up, 2015-2019 : | 21.9% |
| Percentage of people under the age of 65 who have a disability, 2015-2019 : | 9.0% |
| Persons under the age of 65 who do not have health insurance, as a percentage : | 11.0% |
| Total civilian labor force, percent of population aged 16 and up, 2015-2019 : | 56.5% |
| Female labor force participation in the civilian labor force, as a percentage of the population aged 16 and up, 2015-2019 : | 63.0% |
| Total sales of lodging and food services in 2012 ($1,000) : | 11,573 |
| 2012 total retail sales ($1,000) : | 100,262 |
| 2012 total retail sales per capita : | $15,458 |
| Mean commute time to work (in minutes), workers aged 16 and up, 2015-2019 : | 38.0 |
| 2015-2019 median household income (in 2019 dollars) : | $45,488 |
| Income per capita in the previous 12 months (in 2019 dollars), 2015-2019 : | $20,019 |
| Percentage of people living in poverty : | 25.0% |
| Total number of businesses in 2012 : | 371 |
| Men-owned businesses in 2012 : | 156 |
| Women-owned businesses in 2012 : | 189 |
| Minority-owned businesses in 2012 : | 300 |
| Non-minority-owned businesses in 2012 : | 52 |
| Veteran-owned businesses in 2012 : | 25 |
| Nonveteran-owned businesses in 2012 : | 327 |
| 2010 population per square mile : | 2,474.6 |
| 2010 land area in square miles : | 2.60 |
| Rate of owner-occupied housing units, 2015-2019 : | 59.0% |
| Owner-occupied housing unit median value, 2015-2019 : | $214,500 |
| From 2015 to 2019, the median selected monthly owner costs - with a mortgage : | $1,600 |
| Monthly owner costs, without a mortgage, at the median, 2015-2019 : | $424 |
| 2015-2019 median gross rent : | $1,250 |
| 2015-2019 Households : | 8,794 |
| Population per household, 2015-2019 : | 2.70 |
| Living in the same house a year ago, percentage of people aged one year and up, 2015-2019 : | 81.4% |
| Languages other than English spoken at home, as a percentage of people aged 5 and up, 2015-2019 : | 10.2% |
| Households with computers, %, 2015-2019 : | 95.3% |
| Percentage of households with a broadband Internet subscription, 2015-2019 : | 89.7% |
| Percentage of people aged 25 and up with a high school diploma or higher, 2015-2019 : | 92.0% |
| Bachelor's degree or higher, proportion of people aged 25 and up, 2015-2019 : | 38.2% |
| Percentage of people under the age of 65 who have a disability, 2015-2019 : | 9.0% |
| Persons under the age of 65 who do not have health insurance, as a percentage : | 10.6% |
| Total civilian labor force, percent of population aged 16 and up, 2015-2019 : | 73.8% |
| Female labor force participation in the civilian labor force, as a percentage of the population aged 16 and up, 2015-2019 : | 70.9% |
| Total sales of lodging and food services in 2012 ($1,000) : | 78,959 |
| Total receipts/revenue for health care and social assistance in 2012 ($1,000) : | 26,844 |
| 2012 total retail sales ($1,000) : | 493,537 |
| 2012 total retail sales per capita : | $23,960 |
| Mean commute time to work (in minutes), workers aged 16 and up, 2015-2019 : | 22.0 |
| 2015-2019 median household income (in 2019 dollars) : | $79,426 |
| Income per capita in the previous 12 months (in 2019 dollars), 2015-2019 : | $36,379 |
| Percentage of people living in poverty : | 4.7% |
| Total number of businesses in 2012 : | 2,100 |
| Men-owned businesses in 2012 : | 970 |
| Women-owned businesses in 2012 : | 915 |
| Minority-owned businesses in 2012 : | 799 |
| Non-minority-owned businesses in 2012 : | 1,211 |
| Veteran-owned businesses in 2012 : | 251 |
| Nonveteran-owned businesses in 2012 : | 1,740 |
| 2010 population per square mile : | 651.3 |
| 2010 land area in square miles : | 29.39 |
| Rate of owner-occupied housing units, 2015-2019 : | 67.5% |
| Owner-occupied housing unit median value, 2015-2019 : | $162,800 |
| From 2015 to 2019, the median selected monthly owner costs - with a mortgage : | $1,377 |
| Monthly owner costs, without a mortgage, at the median, 2015-2019 : | $443 |
| 2015-2019 median gross rent : | $1,176 |
| 2015-2019 Households : | 33,091 |
| Population per household, 2015-2019 : | 2.90 |
| Living in the same house a year ago, percentage of people aged one year and up, 2015-2019 : | 88.2% |
| Languages other than English spoken at home, as a percentage of people aged 5 and up, 2015-2019 : | 6.4% |
| Households with computers, %, 2015-2019 : | 94.9% |
| Percentage of households with a broadband Internet subscription, 2015-2019 : | 85.8% |
| Percentage of people aged 25 and up with a high school diploma or higher, 2015-2019 : | 94.1% |
| Bachelor's degree or higher, proportion of people aged 25 and up, 2015-2019 : | 37.4% |
| Percentage of people under the age of 65 who have a disability, 2015-2019 : | 8.7% |
| Persons under the age of 65 who do not have health insurance, as a percentage : | 12.9% |
| Total civilian labor force, percent of population aged 16 and up, 2015-2019 : | 68.8% |
| Female labor force participation in the civilian labor force, as a percentage of the population aged 16 and up, 2015-2019 : | 68.2% |
| 2012 total retail sales per capita : | NA |
| Mean commute time to work (in minutes), workers aged 16 and up, 2015-2019 : | 34.3 |
| 2015-2019 median household income (in 2019 dollars) : | $65,919 |
| Income per capita in the previous 12 months (in 2019 dollars), 2015-2019 : | $30,162 |
| Percentage of people living in poverty : | 9.1% |
| Total number of businesses in 2012 : | F |
| Men-owned businesses in 2012 : | F |
| Women-owned businesses in 2012 : | F |
| Minority-owned businesses in 2012 : | F |
| Non-minority-owned businesses in 2012 : | F |
| Veteran-owned businesses in 2012 : | F |
| Nonveteran-owned businesses in 2012 : | F |
| 2010 population per square mile : | NA |
| 2010 land area in square miles : | NA |
Best Things to Do in North Chicago
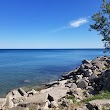
1Greenbelt Forest Preserve
1110 S Green Bay Rd, North Chicago, IL 60035, United States View details
Phone: +18473676640 | Website available

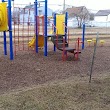
2Foss Park
1901 Foss Park Ave, North Chicago, IL 60088, United States View details
Phone: +18476897480 | Website available
3Neville Park
1500-1598 Glenn Dr, North Chicago, IL 60064, United States View details
Where to Eat in North Chicago
1KFC
2200 Green Bay Rd, North Chicago, IL 60064, United States View details
Phone: +18474734258 | Website available

2Subway
2302 Green Bay Rd, North Chicago, IL 60064, United States View details
Phone: +18474730006 | Website available

People born in North Chicago (2)
People born in North Chicago, including football player, running back Michael Turner, painter William A. Newman, .
More notable people
Nearby Schools and Colleges
Schools and campuses linked to North Chicago, IL. Select a name to open its map and contact details.
| Code | Name | City | ZIP |
|---|---|---|---|
| 145558 | Rosalind Franklin University of Medicine and Science | North Chicago (IL) | 60064-3095 |
Nearby Transit Stations (21)
Rail and bus stations connected to North Chicago, IL. Select a station to open its map and address details.
| Code | Name | Address | Type |
|---|---|---|---|
| GLN | Glenview station | 1116 Depot St. | RAIL |
| SVT | Sturtevant station | 9900 East Exploration Court | RAIL |
| CHI | Chicago Union Station | 225 South Canal Street | RAIL |
| LAG | La Grange Road | 25 West Burlington St. | RAIL |
| SMT | Summit | Archer Ave. and South Center Ave. | RAIL |
Closest post offices linked to North Chicago.
| Post Office Name | City | ZIP |
|---|---|---|
| North Chicag Post Office | North Chicago (IL) | 60064 |
Other cities in Lake County
Cities, towns, neighborhoods & other populated places in Lake County , IL. (more)
| City Name | Population | Title |
|---|---|---|
| Waukegan | 85,453 | The second most populous city in Lake County, Illinois. |
| Mundelein | 30,945 | Village in Lake County, Illinois, United States |
| Gurnee | 30,168 | Village in Illinois |
| Highland Park | 29,427 | City in Lake County, Illinois, United States |
| Round Lake Beach | 26,919 | City in Illinois, United States of America |
| Vernon Hills | 26,425 | City in United States of America |
| Zion | 23,321 | City in Lake County, Illinois, US |
| Grayslake | 20,584 | Village in Lake County, Illinois, United States |
| Libertyville | 20,155 | Village in Lake County, Illinois, United States |
| Lake Zurich | 19,760 | Village in Lake County, Illinois, United States |
| Lake Forest | 19,379 | City in Lake County, Illinois, United States |
| Deerfield | 18,532 | Village in Illinois |
| Round Lake | 17,982 | City in Illinois, United States of America |
| Antioch | 14,174 | Town in the American state of Illinois |
| Lindenhurst | 14,117 | City in Illinois, United States of America |
| Beach Park | 13,641 | City in Illinois, United States of America |
Distance to Other Cities
North Chicago distances to largest Illinois cities