Lake Forest, Illinois
Lake Forest: city in Lake County, Illinois, United States
About
Lake Forest is a city located in the county of Lake in the U.S. state of Illinois. Its population at the 2010 census was 19,375 and a population density of 434 people per km². After 10 years in 2020 city had an estimated population of 19,379 inhabitants.
The city was created 165 years ago in 1860.

Quick Facts about Lake Forest
| Population | 19,379 (2020) |
| Country | United States of America |
| State | Illinois (United States) |
| County | Lake County |
| Postal code | 60045 |
| Area | 44.66 km2 |
| Latitude & Longitude | 42.2586,-87.8406 |
| Establishment | January 01, 1861 (165 years ago) |
| Time Zone | America/Chicago |
| Local time | 08:28:20 (14th July 2026) |
| Density | 434 Pop. per km² as of 2020 |
| Population growth | 0.02% (2010-2020) |
| Weather | 95℉ Sunny 7-days weather |

Geography
Lake Forest is located at 42°15'31"N 87°50'26"W (42.2586300, -87.8406300). It has 2 neighbors: Highland Park and Lake Bluff.
Lake Forest map
Weather
Sunny, with a high near 95. West wind around 5 mph, with gusts as high as 10 mph.
7-Day ForecastOfficial website of Lake Forest
Official WebsiteDemographics
The population of Lake Forest increased by 0.02% in 10 years.
| Year | Population | % Change | Method |
|---|---|---|---|
| 2010 | 19,375 | - | census |
| 2011 | 19,378 | 0.02% | estimation process |
| 2012 | 19,399 | 0.11% | estimation process |
| 2013 | 19,467 | 0.35% | estimation process |
| 2014 | 19,477 | 0.05% | estimation process |
| 2015 | 19,424 | -0.27% | estimation process |
| 2016 | 19,403 | -0.11% | estimation process |
| 2017 | 19,598 | 0.99% | estimation process |
| 2018 | 19,516 | -0.42% | estimation process |
| 2019 | 19,446 | -0.36% | estimation process |
| 2020 | 19,379 | -0.35% | estimation process |
Demographic Facts
| Estimated population as of July 1, 2019 : | 75,995 |
| Based on demographic estimates as of April 1, 2010 : | 71,412 |
| Based on demographic estimates as of 1 April 2010 : | 6.4% |
| April 1, 2020 Population : | 84,605 |
| April 1, 2010 Population : | 72,148 |
| People under 5 years old, percentage : | 5.4% |
| People under 18 years old, percentage : | 28.3% |
| People over 65 (%) : | 10.5% |
| Female persons, % : | 49.7% |
| White only, percent : | 43.1% |
| Black or African American alone, percent : | 2.3% |
| American Indian and Alaska Native only, % : | 0.4% |
| Asians alone % : | 46.7% |
| Only Native Hawaiians and Other Pacific Islanders, % : | 0.4% |
| % of people who have participated in two or more races : | 5.8% |
| % of Hispanic or Latino : | 7.1% |
| White people, not Hispanic or Latino people, make up the majority of the population. : | 38.6% |
| 2015-2019 Veterans : | 1,979 |
| Percentage of foreign-born people, 2015-2019 : | 37.0% |
| Rate of owner-occupied housing units, 2015-2019 : | 72.4% |
Economic Facts
| Rate of owner-occupied housing units, 2015-2019 : | 72.4% |
| Owner-occupied housing unit median value, 2015-2019 : | $958,800 |
| From 2015 to 2019, the median selected monthly owner costs - with a mortgage : | $3,849 |
| Monthly owner costs, without a mortgage, at the median, 2015-2019 : | $1,066 |
| 2015-2019 median gross rent : | $2,391 |
| 2015-2019 Households : | 25,535 |
| Population per household, 2015-2019 : | 2.96 |
| Living in the same house a year ago, percentage of people aged one year and up, 2015-2019 : | 86.4% |
| Languages other than English spoken at home, as a percentage of people aged 5 and up, 2015-2019 : | 44.2% |
| Households with computers, %, 2015-2019 : | 98.3% |
| Percentage of households with a broadband Internet subscription, 2015-2019 : | 96.6% |
| Percentage of people aged 25 and up with a high school diploma or higher, 2015-2019 : | 96.4% |
| Bachelor's degree or higher, proportion of people aged 25 and up, 2015-2019 : | 70.6% |
| Percentage of people under the age of 65 who have a disability, 2015-2019 : | 3.1% |
| Persons under the age of 65 who do not have health insurance, as a percentage : | 2.3% |
| Total civilian labor force, percent of population aged 16 and up, 2015-2019 : | 68.8% |
| Female labor force participation in the civilian labor force, as a percentage of the population aged 16 and up, 2015-2019 : | 60.1% |
| Total sales of lodging and food services in 2012 ($1,000) : | 159,782 |
| Total receipts/revenue for health care and social assistance in 2012 ($1,000) : | 430,788 |
| 2012 total retail sales ($1,000) : | 671,450 |
| 2012 total retail sales per capita : | $9,083 |
| Mean commute time to work (in minutes), workers aged 16 and up, 2015-2019 : | 38.8 |
| 2015-2019 median household income (in 2019 dollars) : | $160,783 |
| Income per capita in the previous 12 months (in 2019 dollars), 2015-2019 : | $63,782 |
| Percentage of people living in poverty : | 3.7% |
| Total number of businesses in 2012 : | 7,423 |
| Men-owned businesses in 2012 : | 3,450 |
| Women-owned businesses in 2012 : | 2,742 |
| Minority-owned businesses in 2012 : | 2,922 |
| Non-minority-owned businesses in 2012 : | 4,079 |
| Veteran-owned businesses in 2012 : | 519 |
| Nonveteran-owned businesses in 2012 : | 6,522 |
| 2010 population per square mile : | 3,994.7 |
| 2010 land area in square miles : | 18.06 |
| Rate of owner-occupied housing units, 2015-2019 : | 53.3% |
| Owner-occupied housing unit median value, 2015-2019 : | $180,700 |
| From 2015 to 2019, the median selected monthly owner costs - with a mortgage : | $1,464 |
| Monthly owner costs, without a mortgage, at the median, 2015-2019 : | $562 |
| 2015-2019 median gross rent : | $1,177 |
| 2015-2019 Households : | 10,244 |
| Population per household, 2015-2019 : | 2.84 |
| Living in the same house a year ago, percentage of people aged one year and up, 2015-2019 : | 83.4% |
| Languages other than English spoken at home, as a percentage of people aged 5 and up, 2015-2019 : | 17.8% |
| Households with computers, %, 2015-2019 : | 93.9% |
| Percentage of households with a broadband Internet subscription, 2015-2019 : | 81.5% |
| Percentage of people aged 25 and up with a high school diploma or higher, 2015-2019 : | 88.2% |
| Bachelor's degree or higher, proportion of people aged 25 and up, 2015-2019 : | 31.4% |
| Percentage of people under the age of 65 who have a disability, 2015-2019 : | 7.1% |
| Persons under the age of 65 who do not have health insurance, as a percentage : | 14.6% |
| Total civilian labor force, percent of population aged 16 and up, 2015-2019 : | 71.0% |
| Female labor force participation in the civilian labor force, as a percentage of the population aged 16 and up, 2015-2019 : | 71.3% |
| Total sales of lodging and food services in 2012 ($1,000) : | 57,764 |
| Total receipts/revenue for health care and social assistance in 2012 ($1,000) : | 489,859 |
| Manufacturers' total shipments in 2012 ($1,000) : | 21,265 |
| 2012 total retail sales ($1,000) : | 443,821 |
| 2012 total retail sales per capita : | $16,888 |
| Mean commute time to work (in minutes), workers aged 16 and up, 2015-2019 : | 31.8 |
| 2015-2019 median household income (in 2019 dollars) : | $61,291 |
| Income per capita in the previous 12 months (in 2019 dollars), 2015-2019 : | $27,129 |
| Percentage of people living in poverty : | 12.4% |
| Total number of businesses in 2012 : | 3,084 |
| Men-owned businesses in 2012 : | 1,467 |
| Women-owned businesses in 2012 : | 1,322 |
| Minority-owned businesses in 2012 : | 2,170 |
| Non-minority-owned businesses in 2012 : | 767 |
| Veteran-owned businesses in 2012 : | 316 |
| Nonveteran-owned businesses in 2012 : | 2,596 |
| 2010 population per square mile : | 1,926.1 |
| 2010 land area in square miles : | 13.31 |
Best Things to Do in Lake Forest
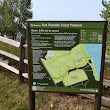
1Fort Sheridan Forest Preserve
1275 Gilgare Ln, Lake Forest, IL 60045, United States View details
Phone: +18473676640 | Website available
2Prairie Wolf Dog Park
1917-2075 S Waukegan Rd, Lake Forest, IL 60045, United States View details
Phone: +18473676640 | Website available

3Forest Park
801 N Lake Rd, Lake Forest, IL 60045, United States View details
Phone: +18472342600 | Website available
4Middlefork Savanna Forest Preserve
1401 Middlefork Dr, Lake Forest, IL 60045, United States View details
Phone: +18473676640 | Website available
5Wildlife Discovery Center
1401 Middlefork Dr, Lake Forest, IL 60045, United States View details
Phone: +18478103663 | Website available
Services and Civic Places in Lake Forest
1Hospital Support Services Building
940 N Westmoreland Rd, Lake Forest, IL 60045, United States View details
People born in Lake Forest (56)
People born in Lake Forest, including swimmer, Olympic gold medalist, world champion, world record-holder Matt Grevers, politician Pete Wilson, hungarian ice hockey player Roger Holéczy, .
More notable people
- Sylvia Shaw Judson (American artist) she was born in 30/06/1897
- Michael Glasder (American ski jumper) he was born in 27/03/1989
- Karl Patterson Schmidt (American herpetologist) he was born in 19/06/1890
- William Proxmire (American politician (1915-2005)) he was born in 11/11/1915
- McKey Sullivan (American model) she was born in 09/09/1988
- Charlie Houchin (American swimmer, Olympic gold medalist, world champion) he was born in 03/11/1987
- Charles F. Knight (American businessman) he was born in 20/01/1936
- Brooke Wyckoff (American basketball player) she was born in 30/03/1980
- Gabe Carimi (American football player, offensive lineman) he was born in 13/06/1988
- Joe Hickerson (folklorist, songleader, librarian) he was born in 20/10/1935
- Tyler Smith (American basketball player (1980-)) he was born in 07/01/1980
- Craig Spitzer (American basketball player) he was born in 18/12/1945
- Prince Rostislav Romanov (born 1985) he was born in 21/05/1985
- A. B. Dick (American businessman) he was born in 16/04/1856
- Ben Croft (American racquetball player) he was born in 11/02/1985
- Catherine Warren (American model) she was born in 12/02/1984
- George Bolan (American football player (1897-1940)) he was born in 30/04/1897
- Glenn Gissler (American interior designer) he was born in 01/01/1957
Nearby Schools and Colleges
Schools and campuses linked to Lake Forest, IL. Select a name to open its map and contact details.
| Code | Name | City | ZIP |
|---|---|---|---|
| 146481 | Lake Forest College | Lake Forest (IL) | 60045-2399 |
Nearby Transit Stations (21)
Rail and bus stations connected to Lake Forest, IL. Select a station to open its map and address details.
| Code | Name | Address | Type |
|---|---|---|---|
| GLN | Glenview station | 1116 Depot St. | RAIL |
| CHI | Chicago Union Station | 225 South Canal Street | RAIL |
| LAG | La Grange Road | 25 West Burlington St. | RAIL |
| SVT | Sturtevant station | 9900 East Exploration Court | RAIL |
| SMT | Summit | Archer Ave. and South Center Ave. | RAIL |
Closest post offices linked to Lake Forest.
| Post Office Name | City | ZIP |
|---|---|---|
| Lake For Post Office | Lake Forest (IL) | 60045 |
Other places with the same name (1)
- Lake Forest, California A city in Orange County, California. with a population of 85,329 people.
Other cities in Lake County
Cities, towns, neighborhoods & other populated places in Lake County , IL. (more)
| City Name | Population | Title |
|---|---|---|
| Waukegan | 85,453 | The second most populous city in Lake County, Illinois. |
| Mundelein | 30,945 | Village in Lake County, Illinois, United States |
| Gurnee | 30,168 | Village in Illinois |
| North Chicago | 29,639 | City and suburb of Chicago, Illinois, USA |
| Highland Park | 29,427 | City in Lake County, Illinois, United States |
| Round Lake Beach | 26,919 | City in Illinois, United States of America |
| Vernon Hills | 26,425 | City in United States of America |
| Zion | 23,321 | City in Lake County, Illinois, US |
| Grayslake | 20,584 | Village in Lake County, Illinois, United States |
| Libertyville | 20,155 | Village in Lake County, Illinois, United States |
| Lake Zurich | 19,760 | Village in Lake County, Illinois, United States |
| Deerfield | 18,532 | Village in Illinois |
| Round Lake | 17,982 | City in Illinois, United States of America |
| Antioch | 14,174 | Town in the American state of Illinois |
| Lindenhurst | 14,117 | City in Illinois, United States of America |
| Beach Park | 13,641 | City in Illinois, United States of America |
Distance to Other Cities
Lake Forest distances to largest Illinois cities