Round Lake Beach, Illinois
Round Lake Beach: city in Illinois, United States of America
About
Round Lake Beach is a city located in the county of Lake in the U.S. state of Illinois. Its population at the 2010 census was 28,175 and a population density of 2,085 people per km². After 10 years in 2020 city had an estimated population of 26,919 inhabitants.

Quick Facts about Round Lake Beach
| Population | 26,919 (2020) |
| Country | United States of America |
| State | Illinois (United States) |
| County | Lake County |
| Postal code | 60073 |
| Area | 13.51 km2 |
| Latitude & Longitude | 42.3717,-88.0901 |
| Altitude | 2,657 feet / 810 meters |
| Time Zone | America/Chicago |
| Local time | 04:57:57 (15th July 2026) |
| Density | 1,992 Pop. per km² as of 2020 |
| Population growth | -4.67% (2010-2020) |
| Weather | 72℉ Mostly Clear 7-days weather |
Geography
Round Lake Beach is located at 42°22'18"N 88°5'24"W (42.3716900, -88.0900800).
Round Lake Beach map
Weather
Mostly clear, with a low around 72. Heat index values as high as 97. West southwest wind around 5 mph.
7-Day ForecastOfficial website of Round Lake Beach
Official WebsiteDemographics
According to census records, the population of Round Lake Beach decreased by 4.67% in 10 years.
| Year | Population | % Change | Method |
|---|---|---|---|
| 2010 | 28,175 | - | census |
| 2011 | 28,049 | -0.45% | estimation process |
| 2012 | 27,984 | -0.23% | estimation process |
| 2013 | 28,001 | 0.06% | estimation process |
| 2014 | 27,953 | -0.17% | estimation process |
| 2015 | 27,803 | -0.54% | estimation process |
| 2016 | 27,715 | -0.32% | estimation process |
| 2017 | 27,560 | -0.56% | estimation process |
| 2018 | 27,284 | -1.01% | estimation process |
| 2019 | 27,100 | -0.68% | estimation process |
| 2020 | 26,919 | -0.67% | estimation process |
Demographic Facts
| Estimated population as of July 1, 2019 : | 106,280 |
| Based on demographic estimates as of April 1, 2010 : | 101,116 |
| Based on demographic estimates as of 1 April 2010 : | 5.1% |
| April 1, 2020 Population : | 104,901 |
| April 1, 2010 Population : | 101,123 |
| People under 5 years old, percentage : | 4.5% |
| People under 18 years old, percentage : | 15.7% |
| People over 65 (%) : | 17.1% |
| Female persons, % : | 50.6% |
| White only, percent : | 21.3% |
| Black or African American alone, percent : | 3.4% |
| American Indian and Alaska Native only, % : | 0.4% |
| Asians alone % : | 58.1% |
| Only Native Hawaiians and Other Pacific Islanders, % : | 1.4% |
| % of people who have participated in two or more races : | 4.7% |
| % of Hispanic or Latino : | 22.9% |
| White people, not Hispanic or Latino people, make up the majority of the population. : | 12.1% |
| 2015-2019 Veterans : | 3,133 |
| Percentage of foreign-born people, 2015-2019 : | 51.9% |
| Rate of owner-occupied housing units, 2015-2019 : | 58.3% |
Economic Facts
| Rate of owner-occupied housing units, 2015-2019 : | 58.3% |
| Owner-occupied housing unit median value, 2015-2019 : | $783,400 |
| From 2015 to 2019, the median selected monthly owner costs - with a mortgage : | $2,806 |
| Monthly owner costs, without a mortgage, at the median, 2015-2019 : | $603 |
| 2015-2019 median gross rent : | $2,220 |
| 2015-2019 Households : | 31,796 |
| Population per household, 2015-2019 : | 3.33 |
| Living in the same house a year ago, percentage of people aged one year and up, 2015-2019 : | 91.4% |
| Languages other than English spoken at home, as a percentage of people aged 5 and up, 2015-2019 : | 66.6% |
| Households with computers, %, 2015-2019 : | 94.8% |
| Percentage of households with a broadband Internet subscription, 2015-2019 : | 89.1% |
| Percentage of people aged 25 and up with a high school diploma or higher, 2015-2019 : | 86.9% |
| Bachelor's degree or higher, proportion of people aged 25 and up, 2015-2019 : | 37.7% |
| Percentage of people under the age of 65 who have a disability, 2015-2019 : | 4.1% |
| Persons under the age of 65 who do not have health insurance, as a percentage : | 5.8% |
| Total civilian labor force, percent of population aged 16 and up, 2015-2019 : | 68.4% |
| Female labor force participation in the civilian labor force, as a percentage of the population aged 16 and up, 2015-2019 : | 64.3% |
| Total sales of lodging and food services in 2012 ($1,000) : | 165,708 |
| Total receipts/revenue for health care and social assistance in 2012 ($1,000) : | 636,591 |
| 2012 total retail sales ($1,000) : | 885,400 |
| 2012 total retail sales per capita : | $8,539 |
| Mean commute time to work (in minutes), workers aged 16 and up, 2015-2019 : | 30.8 |
| 2015-2019 median household income (in 2019 dollars) : | $94,550 |
| Income per capita in the previous 12 months (in 2019 dollars), 2015-2019 : | $36,654 |
| Percentage of people living in poverty : | 7.6% |
| Total number of businesses in 2012 : | 7,290 |
| Men-owned businesses in 2012 : | 4,277 |
| Women-owned businesses in 2012 : | 2,434 |
| Minority-owned businesses in 2012 : | 5,444 |
| Non-minority-owned businesses in 2012 : | 1,592 |
| Veteran-owned businesses in 2012 : | 321 |
| Nonveteran-owned businesses in 2012 : | 6,742 |
| 2010 population per square mile : | 13,195.0 |
| 2010 land area in square miles : | 7.66 |
| Residential units, July 1, 2019 : | 65,554 |
| Rate of owner-occupied housing units, 2015-2019 : | 71.8% |
| Owner-occupied housing unit median value, 2015-2019 : | $237,600 |
| From 2015 to 2019, the median selected monthly owner costs - with a mortgage : | $1,874 |
| Monthly owner costs, without a mortgage, at the median, 2015-2019 : | $831 |
| 2015-2019 median gross rent : | $1,042 |
| Permits for construction, 2020 : | 477 |
| 2015-2019 Households : | 58,452 |
| Population per household, 2015-2019 : | 2.45 |
| Living in the same house a year ago, percentage of people aged one year and up, 2015-2019 : | 88.2% |
| Languages other than English spoken at home, as a percentage of people aged 5 and up, 2015-2019 : | 6.0% |
| Households with computers, %, 2015-2019 : | 92.3% |
| Percentage of households with a broadband Internet subscription, 2015-2019 : | 86.5% |
| Percentage of people aged 25 and up with a high school diploma or higher, 2015-2019 : | 93.2% |
| Bachelor's degree or higher, proportion of people aged 25 and up, 2015-2019 : | 35.6% |
| Percentage of people under the age of 65 who have a disability, 2015-2019 : | 10.1% |
| Persons under the age of 65 who do not have health insurance, as a percentage : | 7.3% |
| Total civilian labor force, percent of population aged 16 and up, 2015-2019 : | 66.5% |
| Female labor force participation in the civilian labor force, as a percentage of the population aged 16 and up, 2015-2019 : | 63.4% |
| Total sales of lodging and food services in 2012 ($1,000) : | 238,720 |
| Total receipts/revenue for health care and social assistance in 2012 ($1,000) : | 1,239,700 |
| Manufacturers' total shipments in 2012 ($1,000) : | 1,577,343 |
| 2012 total retail sales ($1,000) : | 2,819,693 |
| 2012 total retail sales per capita : | $19,213 |
| Mean commute time to work (in minutes), workers aged 16 and up, 2015-2019 : | 27.1 |
| 2015-2019 median household income (in 2019 dollars) : | $75,737 |
| Income per capita in the previous 12 months (in 2019 dollars), 2015-2019 : | $37,367 |
| Percentage of people living in poverty : | 6.4% |
| Total number of employer establishments, 2019 : | 4,123 |
| 2019 total employment : | 63,450 |
| 2019 total annual payroll ($1,000) : | 3,118,722 |
| Total employment, change in percentage terms, 2018-2019 : | -1.2% |
| 2018 total non-employer establishments : | 11,453 |
| Total number of businesses in 2012 : | 14,562 |
| Men-owned businesses in 2012 : | 8,130 |
| Women-owned businesses in 2012 : | 4,153 |
| Minority-owned businesses in 2012 : | 405 |
| Non-minority-owned businesses in 2012 : | 13,420 |
| Veteran-owned businesses in 2012 : | 1,708 |
| Nonveteran-owned businesses in 2012 : | 11,845 |
| 2010 population per square mile : | 156.8 |
| 2010 land area in square miles : | 934.12 |
| Rate of owner-occupied housing units, 2015-2019 : | 45.2% |
| Owner-occupied housing unit median value, 2015-2019 : | $442,500 |
| From 2015 to 2019, the median selected monthly owner costs - with a mortgage : | $2,946 |
| Monthly owner costs, without a mortgage, at the median, 2015-2019 : | $1,041 |
| 2015-2019 median gross rent : | $1,584 |
| 2015-2019 Households : | 3,827 |
| Population per household, 2015-2019 : | 2.93 |
| Living in the same house a year ago, percentage of people aged one year and up, 2015-2019 : | 94.2% |
| Languages other than English spoken at home, as a percentage of people aged 5 and up, 2015-2019 : | 64.6% |
| Households with computers, %, 2015-2019 : | 94.0% |
| Percentage of households with a broadband Internet subscription, 2015-2019 : | 86.7% |
| Percentage of people aged 25 and up with a high school diploma or higher, 2015-2019 : | 92.8% |
| Bachelor's degree or higher, proportion of people aged 25 and up, 2015-2019 : | 39.1% |
| Percentage of people under the age of 65 who have a disability, 2015-2019 : | 4.9% |
| Persons under the age of 65 who do not have health insurance, as a percentage : | 15.5% |
| Total civilian labor force, percent of population aged 16 and up, 2015-2019 : | 65.7% |
| Female labor force participation in the civilian labor force, as a percentage of the population aged 16 and up, 2015-2019 : | 60.1% |
| Total sales of lodging and food services in 2012 ($1,000) : | 25,224 |
| Manufacturers' total shipments in 2012 ($1,000) : | 828,461 |
| 2012 total retail sales ($1,000) : | 239,528 |
| 2012 total retail sales per capita : | $21,282 |
| Mean commute time to work (in minutes), workers aged 16 and up, 2015-2019 : | 27.6 |
| 2015-2019 median household income (in 2019 dollars) : | $71,699 |
| Income per capita in the previous 12 months (in 2019 dollars), 2015-2019 : | $35,191 |
| Percentage of people living in poverty : | 8.7% |
| Total number of businesses in 2012 : | 1,850 |
| Men-owned businesses in 2012 : | 1,143 |
| Women-owned businesses in 2012 : | 425 |
| Minority-owned businesses in 2012 : | 850 |
| Non-minority-owned businesses in 2012 : | 879 |
| Veteran-owned businesses in 2012 : | 143 |
| Nonveteran-owned businesses in 2012 : | 1,622 |
| 2010 population per square mile : | 4,323.7 |
| 2010 land area in square miles : | 2.55 |
Best Things to Do in Round Lake Beach
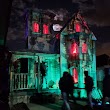
1Realm of Terror Haunted House
421 W Rollins Rd, Round Lake Beach, IL 60073, United States View details
Phone: +18479736053 | Website available
Where to Eat in Round Lake Beach
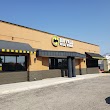
1Popeyes Louisiana Kitchen
221 E Rollins Rd, Round Lake Beach, IL 60073, United States View details
Phone: +18477401793 | Website available

2Kristof's Entertainment Center
421 W Rollins Rd, Round Lake Beach, IL 60073, United States View details
Phone: +18475462512 | Website available

3Buffalo Wild Wings
500 E Rollins Rd, Round Lake Beach, IL 60073, United States View details
Phone: +18475468366 | Website available
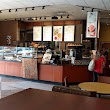
4Panera Bread
254 E Rollins Rd, Round Lake Beach, IL 60073, United States View details
Phone: +18472709683 | Website available
5Jimmy John's
1924 IL-83, Round Lake Beach, IL 60073, United States View details
Phone: +18479862775 | Website available

People born in Round Lake Beach (2)
Nearby Schools and Colleges
Schools and campuses linked to Round Lake Beach, IL. Select a name to open its map and contact details.
| Code | Name | City | ZIP |
|---|---|---|---|
| 146472 | College of Lake County | Grayslake (IL) | 60030-1198 |
Nearby Transit Stations (17)
Rail and bus stations connected to Round Lake Beach, IL. Select a station to open its map and address details.
| Code | Name | Address | Type |
|---|---|---|---|
| SVT | Sturtevant station | 9900 East Exploration Court | RAIL |
| GLN | Glenview station | 1116 Depot St. | RAIL |
| LAG | La Grange Road | 25 West Burlington St. | RAIL |
| MKA | Milwaukee Airport Railroad Station | 5601 South 6th Street | RAIL |
| NPV | Naperville | 105 E. Fourth Ave. | RAIL |
Closest post offices linked to Round Lake Beach.
| Post Office Name | City | ZIP |
|---|---|---|
| Round Lak Post Office | Round Lake (IL) | 60073 |
Other cities in Lake County
Cities, towns, neighborhoods & other populated places in Lake County , IL. (more)
| City Name | Population | Title |
|---|---|---|
| Waukegan | 85,453 | The second most populous city in Lake County, Illinois. |
| Mundelein | 30,945 | Village in Lake County, Illinois, United States |
| Gurnee | 30,168 | Village in Illinois |
| North Chicago | 29,639 | City and suburb of Chicago, Illinois, USA |
| Highland Park | 29,427 | City in Lake County, Illinois, United States |
| Vernon Hills | 26,425 | City in United States of America |
| Zion | 23,321 | City in Lake County, Illinois, US |
| Grayslake | 20,584 | Village in Lake County, Illinois, United States |
| Libertyville | 20,155 | Village in Lake County, Illinois, United States |
| Lake Zurich | 19,760 | Village in Lake County, Illinois, United States |
| Lake Forest | 19,379 | City in Lake County, Illinois, United States |
| Deerfield | 18,532 | Village in Illinois |
| Round Lake | 17,982 | City in Illinois, United States of America |
| Antioch | 14,174 | Town in the American state of Illinois |
| Lindenhurst | 14,117 | City in Illinois, United States of America |
| Beach Park | 13,641 | City in Illinois, United States of America |
Distance to Other Cities
Round Lake Beach distances to largest Illinois cities