Myanmar (Union of Burma), MM
Myanmar: Located in Southeast Asia, this nation boasts a population of over 51 million people and covers an area of approximately 676, 577 square kilometers.
About

Country Snapshot
Union of Burma at a glance
Union of Burma currently has 43 quality-checked populated place pages and 14 state or regional pages linked on MapSof.
Mapped cities & towns
43
These counts use a stricter populated-place filter so the main lists stay focused on real city and town pages.
States & regions
14
Open related pagesLargest city
YangonPopulation 5,430,000
Top linked places
Quick Facts about Union of Burma
| Population | 51,316,756 |
| Country | Myanmar |
| Different from | My |
| Plate code | BUR |
| Area | 676577.2 km2 |
| Official name | မြန်မာနိုင်ငံ, La République de l’Union de Birmanie, Мьянма, République de l’Union de Birmanie, Republic of the Union of Myanmar, Республика Союз Мьянма, Socialist Republic of the Union of Burma, Union of Myanmar, Union of Burma, Repubblica dell'Unione della Birmania, Бирма |
| Continent | Asia |
| Easternmost point | Point(101.17086 21.5992) |
| Northernmost point | Point(97.57 28.55) |
| Latitude & Longitude | 21.0000,96.0000 |
| Legislative body | Assembly of the Union |
| Official language | Burmese |
| Capital | Yangon, Naypyidaw |
| Establishment | January 04, 1948 (78 years ago) |
| Time Zone | UTC+06:30 |
| Local time | 12:25:10 (20th June 2026) |

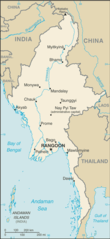
Geography
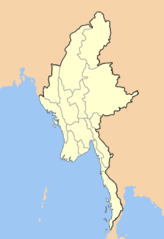
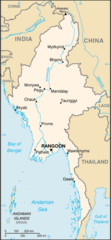
Union of Burma is located at 21°0'0"N 96°0'0"E (21.0000000, 96.0000000). It has 5 neighbors: Bangladesh, India, Thailand, Laos and China.
Myanmar map
The largest city of Union of Burma is Mawlamyine with a population of 438,861. Other cities include, Pathein population 237,089, Monywa population 182,011, Sittwe population 177,743 and Myeik population 173,298. See all Union of Burma cities & populated places.
Official website of Union of Burma
Official WebsiteCompare Union of Burma with
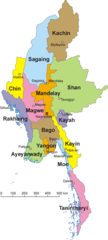
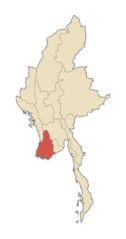
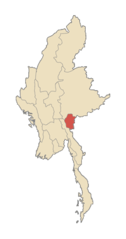
- Kayah State
- Ayeyarwady Region
- Yangon Region
- Naypyidaw Union Territory
- Mon State
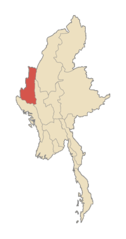
- Chin State
- Naga Self-Administered Zone
- Shan State
- Rakhine State
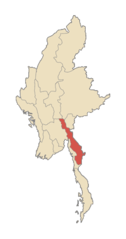
- Kayin State
- Kachin State
- Tanintharyi Region
- Wa Self-Administered Division
- Magway Region
- Danu Self-Administered Zone
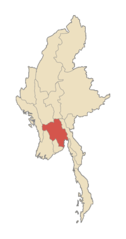
- Mandalay Region
- Pa-O Self-Administered Zone
- Kokang Self-Administered Zone
- Pa Laung Self-Administered Zone
- Sagaing Region
- Bago
Demographics
| Year | Population | % Change | Method |
|---|---|---|---|
| 1960 | 21,486,424 | - | census |
| 1961 | 21,961,594 | 2.16% | census |
| 1962 | 22,446,690 | 2.16% | census |
| 1963 | 22,947,286 | 2.18% | census |
| 1964 | 23,471,163 | 2.23% | census |
| 1965 | 24,023,640 | 2.3% | census |
| 1966 | 24,606,874 | 2.37% | census |
| 1967 | 25,218,411 | 2.42% | census |
| 1968 | 25,853,304 | 2.46% | census |
| 1969 | 26,504,295 | 2.46% | census |
| 1970 | 27,166,045 | 2.44% | census |
| 1971 | 27,836,624 | 2.41% | census |
| 1972 | 28,517,301 | 2.39% | census |
| 1973 | 29,209,751 | 2.37% | census |
| 1974 | 29,916,891 | 2.36% | census |
| 1975 | 30,640,635 | 2.36% | census |
| 1976 | 31,379,211 | 2.35% | census |
| 1977 | 32,130,628 | 2.34% | census |
| 1978 | 32,896,129 | 2.33% | census |
| 1979 | 33,677,496 | 2.32% | census |
| 1980 | 34,474,755 | 2.31% | census |
| 1981 | 35,288,662 | 2.31% | census |
| 1982 | 36,114,948 | 2.29% | census |
| 1983 | 36,942,428 | 2.24% | census |
| 1984 | 37,756,446 | 2.16% | census |
| 1985 | 38,546,211 | 2.05% | census |
| 1986 | 39,307,611 | 1.94% | census |
| 1987 | 40,042,444 | 1.84% | census |
| 1988 | 40,753,329 | 1.74% | census |
| 1989 | 41,445,433 | 1.67% | census |
| 1990 | 42,123,003 | 1.61% | census |
| 1991 | 42,782,387 | 1.54% | census |
| 1992 | 43,422,423 | 1.47% | census |
| 1993 | 44,052,710 | 1.43% | census |
| 1994 | 44,686,091 | 1.42% | census |
| 1995 | 45,329,862 | 1.42% | census |
| 1996 | 45,991,828 | 1.44% | census |
| 1997 | 46,664,455 | 1.44% | census |
| 1998 | 47,321,204 | 1.39% | census |
| 1999 | 47,925,630 | 1.26% | census |
| 2000 | 48,453,000 | 1.09% | census |
| 2001 | 48,894,203 | 0.9% | census |
| 2002 | 49,261,313 | 0.75% | census |
| 2003 | 49,577,152 | 0.64% | census |
| 2004 | 49,875,169 | 0.6% | census |
| 2005 | 50,181,020 | 0.61% | census |
| 2006 | 50,500,070 | 0.63% | census |
| 2007 | 50,828,959 | 0.65% | census |
| 2008 | 51,174,018 | 0.67% | census |
| 2009 | 51,540,490 | 0.71% | census |
| 2010 | 51,931,231 | 0.75% | census |
| 2011 | 52,350,763 | 0.8% | census |
| 2012 | 52,797,319 | 0.85% | census |
| 2013 | 53,259,018 | 0.87% | census |
| 2014 | 52,280,807 | -1.87% | (Worldbank) |
| 2015 | 52,680,726 | 0.76% | (Worldbank) |
| 2016 | 53,045,226 | 0.69% | (Worldbank) |
| 2017 | 53,370,609 | 0.61% | census |
| 2018 | 53,708,395 | 0.63% | (Worldbank) |
| 2019 | 54,045,420 | 0.62% | (Worldbank) |
| 2026 | 51,316,756 | -5.32% |
Map & Images (more maps)
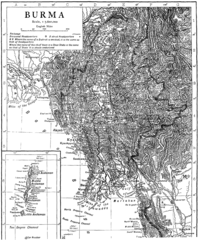
Burma 1
Burma En
Burma Cia Wfb Map
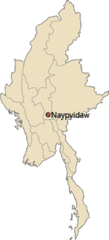
Citylocator Naypyidaw
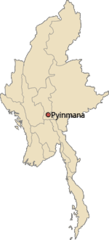
Citylocator Pyinmana
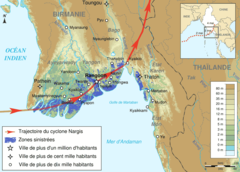
Cyclone Nargis Track Map Fr
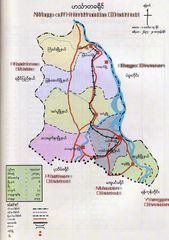
Hinthada District Map
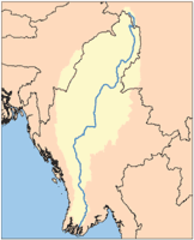
Irrawaddy Watershed
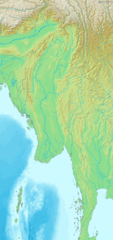
Map of Myanmar Demis
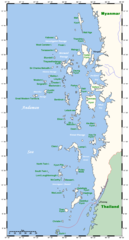
Merguiarchipelagomap
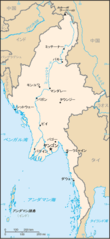
Mm Map Ja
Myanmar Outline Map
Myanmarayeyarwady
Myanmarbago
Myanmarchin
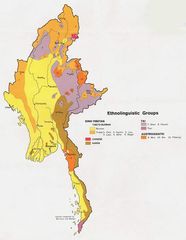
Myanmarethnolinguisticmap1972
Myanmarkaart
Myanmarkayah
Myanmarkayin
Myanmarmagway