Israel (State of Israel), IL
Israel: This Middle Eastern country is situated on the southeastern shore of the Mediterranean Sea and the northern shore of the Red Sea.
About

Country Snapshot
State of Israel at a glance
State of Israel currently has 149 quality-checked populated place pages and 6 state or regional pages linked on MapSof.
Mapped cities & towns
149
These counts use a stricter populated-place filter so the main lists stay focused on real city and town pages.
States & regions
6
Open related pagesLargest city
JerusalemPopulation 919,438
Top linked places
Quick Facts about State of Israel
| Population | 10,134,800 |
| Country | Israel |
| Different from | Israel |
| Instagram username | stateofisrael |
| Twitter username | IsraelHebrew, Israel, IsraelArabic |
| Plate code | IL |
| Area | 20770 km2 |
| Official name | ישראל, دولة إِسرائيل, מדינת ישראל, l’État d’Israël, Estado de Israel |
| Water as percent of area | 2.1% |
| Land as percent of area | 97.9% |
| Continent | Asia |
| Easternmost point | Point(35.896111111 32.945277777) |
| Northernmost point | Point(35.768055555 33.332777777) |
| Latitude & Longitude | 31.5000,34.7500 |
| Legislative body | Knesset |
| Named for | Land of Israel |
| Official language | Arabic, Hebrew |
| Capital | Jerusalem |
| Establishment | May 14, 1948 (78 years ago) |
| Time Zone | Israel time zone, Israel Summer Time |
| Local time | 15:41:53 (16th July 2026) |

Geography
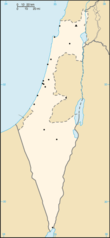
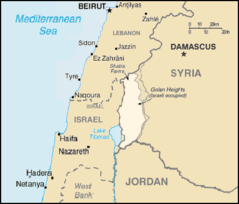
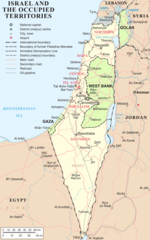
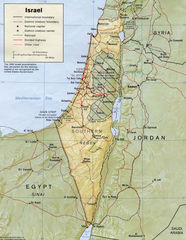
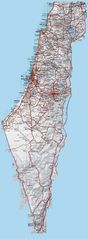
State of Israel is located at 31°30'0"N 34°45'0"E (31.5000000, 34.7500000). It has 7 neighbors: Cyprus, Syria, Jordan, Lebanon, Gaza Strip, West Bank and Egypt.
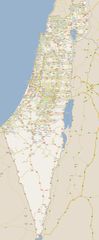
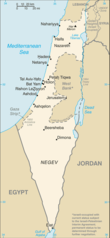
Israel map
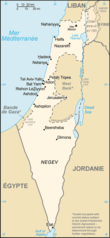
The largest city of State of Israel is Jerusalem with a population of 919,438. Other cities include, Tel Aviv-Yafo population 451,523, Netanya population 217,244, H̱olon population 194,300 and Bnei Brak population 193,774. See all State of Israel cities & populated places.
Official website of State of Israel
Go to Official Website Go to Official Website Go to Official Website Go to Official Website Go to Official Website Go to Official Website Facebook Twitter InstagramCompare State of Israel with
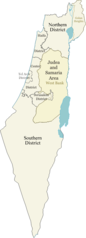
- Haifa District
- Northern District
- Jerusalem District
- Judea and Samaria Area
- Central District
- Southern District
- Tel Aviv District
Demographics
| Year | Population | % Change | Method |
|---|---|---|---|
| 1948 | 872,700 | - | census |
| 1960 | 2,114,020 | 58.72% | (Worldbank) |
| 1961 | 2,185,000 | 3.25% | (Worldbank) |
| 1962 | 2,293,000 | 4.71% | (Worldbank) |
| 1963 | 2,379,000 | 3.61% | (Worldbank) |
| 1964 | 2,475,000 | 3.88% | (Worldbank) |
| 1965 | 2,563,000 | 3.43% | (Worldbank) |
| 1966 | 2,629,000 | 2.51% | (Worldbank) |
| 1967 | 2,745,000 | 4.23% | (Worldbank) |
| 1968 | 2,803,000 | 2.07% | (Worldbank) |
| 1969 | 2,877,000 | 2.57% | (Worldbank) |
| 1970 | 2,974,000 | 3.26% | (Worldbank) |
| 1971 | 3,069,000 | 3.1% | (Worldbank) |
| 1972 | 3,148,000 | 2.51% | (Worldbank) |
| 1973 | 3,278,000 | 3.97% | (Worldbank) |
| 1974 | 3,377,000 | 2.93% | (Worldbank) |
| 1975 | 3,455,000 | 2.26% | (Worldbank) |
| 1976 | 3,533,000 | 2.21% | (Worldbank) |
| 1977 | 3,613,000 | 2.21% | (Worldbank) |
| 1978 | 3,690,000 | 2.09% | (Worldbank) |
| 1979 | 3,786,000 | 2.54% | (Worldbank) |
| 1980 | 3,878,000 | 2.37% | (Worldbank) |
| 1981 | 3,956,000 | 1.97% | (Worldbank) |
| 1982 | 4,031,000 | 1.86% | (Worldbank) |
| 1983 | 4,105,000 | 1.8% | (Worldbank) |
| 1984 | 4,159,000 | 1.3% | (Worldbank) |
| 1985 | 4,233,000 | 1.75% | (Worldbank) |
| 1986 | 4,299,000 | 1.54% | (Worldbank) |
| 1987 | 4,369,000 | 1.6% | (Worldbank) |
| 1988 | 4,442,000 | 1.64% | (Worldbank) |
| 1989 | 4,518,000 | 1.68% | (Worldbank) |
| 1990 | 4,660,000 | 3.05% | (Worldbank) |
| 1991 | 4,949,000 | 5.84% | (Worldbank) |
| 1992 | 5,123,000 | 3.4% | (Worldbank) |
| 1993 | 5,261,000 | 2.62% | (Worldbank) |
| 1994 | 5,399,000 | 2.56% | (Worldbank) |
| 1995 | 5,545,000 | 2.63% | (Worldbank) |
| 1996 | 5,692,000 | 2.58% | (Worldbank) |
| 1997 | 5,836,000 | 2.47% | (Worldbank) |
| 1998 | 5,971,000 | 2.26% | (Worldbank) |
| 1999 | 6,125,000 | 2.51% | (Worldbank) |
| 2000 | 6,289,000 | 2.61% | (Worldbank) |
| 2001 | 6,439,000 | 2.33% | (Worldbank) |
| 2002 | 6,570,000 | 1.99% | (Worldbank) |
| 2003 | 6,689,700 | 1.79% | (Worldbank) |
| 2004 | 6,809,000 | 1.75% | (Worldbank) |
| 2005 | 6,930,100 | 1.75% | (Worldbank) |
| 2006 | 7,053,700 | 1.75% | (Worldbank) |
| 2007 | 7,180,100 | 1.76% | (Worldbank) |
| 2008 | 7,412,200 | 3.13% | census |
| 2009 | 7,485,600 | 0.98% | (Worldbank) |
| 2010 | 7,623,600 | 1.81% | (Worldbank) |
| 2011 | 7,765,800 | 1.83% | (Worldbank) |
| 2012 | 7,910,500 | 1.83% | (Worldbank) |
| 2013 | 8,059,500 | 1.85% | (Worldbank) |
| 2014 | 8,215,700 | 1.9% | (Worldbank) |
| 2015 | 8,463,400 | 2.93% | estimation process |
| 2016 | 8,546,000 | 0.97% | (Worldbank) |
| 2017 | 8,796,200 | 2.84% | estimation process |
| 2018 | 8,891,800 | 1.08% | estimation process |
| 2019 | 9,093,000 | 2.21% | estimation process |
| 2020 | 9,187,000 | 1.02% | estimation process |
| 2026 | 10,134,800 | 9.35% |
Map & Images (more maps)
000 Israel Harta
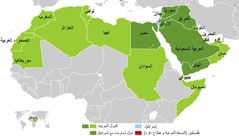
800px Arab Israeli Map2
Carteisrael
Golan Heights Map 1
Israel And Occupied Territories Map
Israel Map

Israel Flag Map
Israel
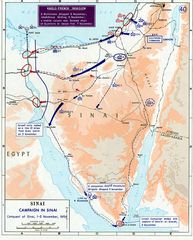
1956 Suez War
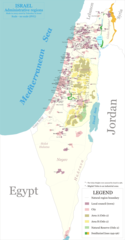
Administrative Regions In Israel
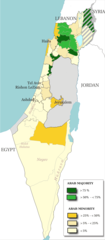
Arab Population In Israel
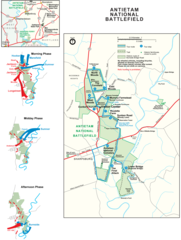
Battlefield of Antietam (sharpsburg) Map
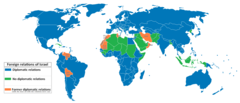
Foreign Relations of Israel Map
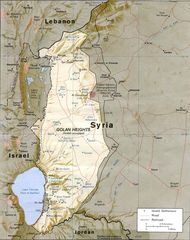
Golan Heights Relief Map
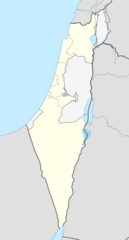
Israel Outline Map
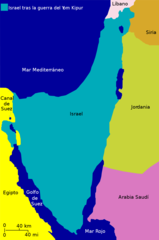
Israel After Yom Kippur War Map
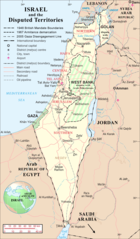
Israel And the Disputed Territories Map
Israel Big Map
Israel Cia Map
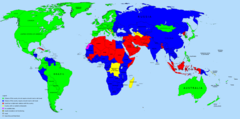
Israel Diplomatic Relations