Egypt (Arab Republic of Egypt), EG
Egypt: Located in northeastern Africa, this transcontinental country spans the northeast corner of Africa and southwest corner of Asia, via a land bridge formed by the Sinai Peninsula.
About

Country Snapshot
Arab Republic of Egypt at a glance
Arab Republic of Egypt currently has 65 quality-checked populated place pages and 14 state or regional pages linked on MapSof.
Mapped cities & towns
65
These counts use a stricter populated-place filter so the main lists stay focused on real city and town pages.
States & regions
14
Open related pagesLargest city
CairoPopulation 9,293,612
Top linked places
Quick Facts about Arab Republic of Egypt
| Population | 107,271,260 |
| Country | Egypt |
| Different from | Q54895077 |
| Plate code | ET |
| Area | 1010407.87 km2 |
| Official name | la République arabe d’Égypte |
| Has part | Lower Egypt |
| Continent | Africa, Asia |
| Easternmost point | Point(36.89432144 22.05445965) |
| Northernmost point | Point(25.9 31.63) |
| Latitude & Longitude | 27.0000,30.0000 |
| Legislative body | Parliament of Egypt |
| Named for | Ptah, Mizraim |
| Official language | Arabic |
| Capital | Cairo |
| Time Zone | UTC+02:00 |
| Local time | 10:57:39 (18th July 2026) |

Geography
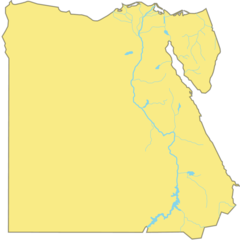
Arab Republic of Egypt is located at 27°0'0"N 30°0'0"E (27.0, 30.0). It has 3 neighbors: Gaza Strip, Israel and Sudan.
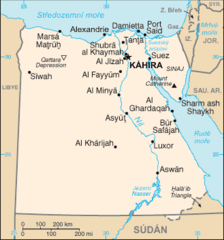
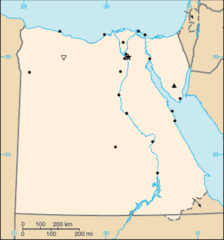
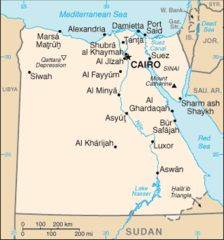
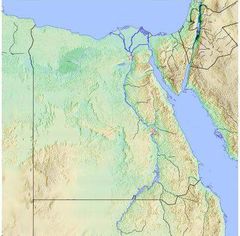
Egypt map
The largest city of Arab Republic of Egypt is Cairo with a population of 9,293,612. Other cities include, Al Maḩallah al Kubrá population 543,271, Būr Sa`īd population 524,433, Suez population 485,342 and Ţanţā population 404,901. See all Arab Republic of Egypt cities & populated places.
Official website of Arab Republic of Egypt
Official WebsiteCompare Arab Republic of Egypt with
- Monufia Governorate
- North Sinai Governorate
- Qena Governorate
- Cairo Governorate
- Qalyubia Governorate
- Beni Suef Governorate
- Sohag Governorate
- Gharbia Governorate
- Matrouh Governorate
- Alexandria Governorate
- Aswan Governorate
- Faiyum Governorate
- Ismailia Governorate
- Luxor Governorate
- Port Said Governorate
- Beheira Governorate
- Minya Governorate
- Giza Governorate
- Asyut Governorate
- Damietta Governorate
- New Valley Governorate
- South Sinai Governorate
- Al Sharqia Governorate
- Red Sea Governorate
- Suez Governorate
- Kafr el-Sheikh Governorate
- Dakahlia Governorate
Demographics
| Year | Population | % Change | Method |
|---|---|---|---|
| 1960 | 27,997,745 | - | estimation process |
| 1961 | 28,785,879 | 2.74% | estimation process |
| 1962 | 29,590,639 | 2.72% | |
| 1963 | 30,409,962 | 2.69% | |
| 1964 | 31,241,836 | 2.66% | estimation process |
| 1965 | 32,083,955 | 2.62% | estimation process |
| 1966 | 32,937,066 | 2.59% | estimation process |
| 1967 | 33,798,820 | 2.55% | estimation process |
| 1968 | 50,660,399 | 33.28% | census |
| 1969 | 35,510,567 | -42.66% | estimation process |
| 1970 | 36,342,268 | 2.29% | estimation process |
| 1971 | 37,152,209 | 2.18% | estimation process |
| 1972 | 37,945,429 | 2.09% | estimation process |
| 1973 | 38,733,784 | 2.04% | |
| 1974 | 39,533,995 | 2.02% | census |
| 1975 | 40,359,038 | 2.04% | |
| 1976 | 41,212,513 | 2.07% | census |
| 1977 | 42,093,668 | 2.09% | census |
| 1978 | 43,005,773 | 2.12% | census |
| 1979 | 43,951,351 | 2.15% | estimation process |
| 1980 | 44,931,971 | 2.18% | estimation process |
| 1981 | 45,945,655 | 2.21% | census |
| 1982 | 46,991,385 | 2.23% | estimation process |
| 1983 | 48,071,851 | 2.25% | census |
| 1984 | 49,190,419 | 2.27% | estimation process |
| 1985 | 50,346,551 | 2.3% | |
| 1986 | 51,545,011 | 2.33% | estimation process |
| 1987 | 52,776,850 | 2.33% | estimation process |
| 1988 | 54,011,214 | 2.29% | |
| 1989 | 55,207,254 | 2.17% | estimation process |
| 1990 | 56,336,614 | 2% | estimation process |
| 1991 | 57,387,589 | 1.83% | census |
| 1992 | 58,370,712 | 1.68% | estimation process |
| 1993 | 59,307,778 | 1.58% | estimation process |
| 1994 | 60,231,864 | 1.53% | census |
| 1995 | 61,168,397 | 1.53% | estimation process |
| 1996 | 59,276,672 | -3.19% | census |
| 1997 | 63,094,069 | 6.05% | estimation process |
| 1998 | 64,084,443 | 1.55% | estimation process |
| 1999 | 65,097,777 | 1.56% | estimation process |
| 2000 | 66,136,590 | 1.57% | estimation process |
| 2001 | 67,204,189 | 1.59% | estimation process |
| 2002 | 68,302,914 | 1.61% | estimation process |
| 2003 | 69,432,477 | 1.63% | estimation process |
| 2004 | 70,591,288 | 1.64% | estimation process |
| 2005 | 71,777,678 | 1.65% | census |
| 2006 | 72,798,031 | 1.4% | census |
| 2007 | 74,229,577 | 1.93% | estimation process |
| 2008 | 75,491,922 | 1.67% | estimation process |
| 2009 | 76,775,023 | 1.67% | estimation process |
| 2010 | 78,075,705 | 1.67% | estimation process |
| 2011 | 79,392,466 | 1.66% | estimation process |
| 2012 | 80,721,874 | 1.65% | estimation process |
| 2013 | 82,056,378 | 1.63% | estimation process |
| 2014 | 90,424,654 | 9.25% | (Worldbank) |
| 2015 | 92,442,547 | 2.18% | (Worldbank) |
| 2016 | 94,447,072 | 2.12% | (Worldbank) |
| 2017 | 94,798,827 | 0.37% | census |
| 2018 | 98,423,595 | 3.68% | (Worldbank) |
| 2019 | 100,388,073 | 1.96% | (Worldbank) |
| 2026 | 107,271,260 | 6.42% |
Map & Images (more maps)
000 Egjipti Harta
288px Nubia Blank 1
At1317 Map 1
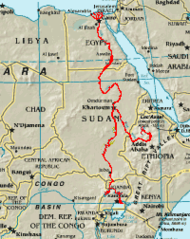
Africa Nilemap 01
Eg Map
Egypt Karnak Test
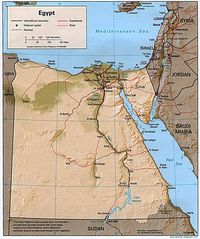
Egypt Map
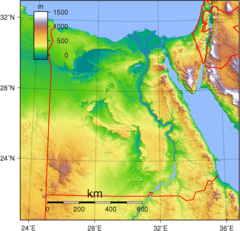
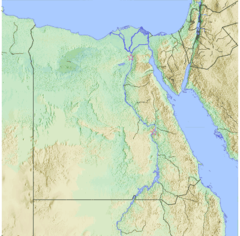
Egypt Topography
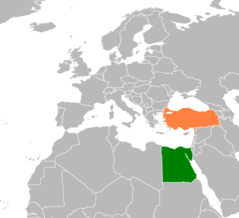
Egypt Turkey Locator
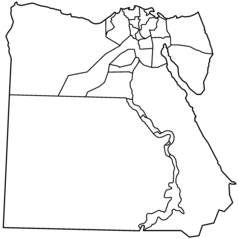
Egypt Governorates Blank
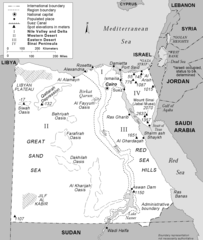
Egypt Regions And Boundaries
Egypt Terrain Map Cairo Karnak
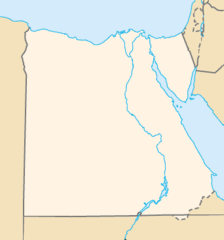
Egypt Locatormap
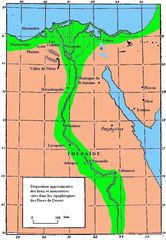
Egypte Monastique Couleur
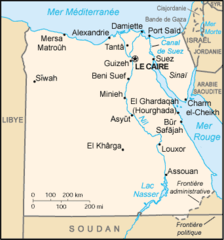
Egypte Carte
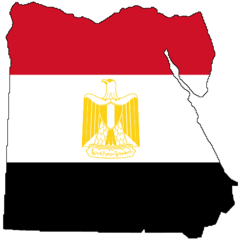
Flag Map of Egypt
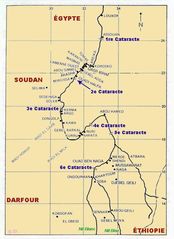
Gd Eg Cataractes Du Nil
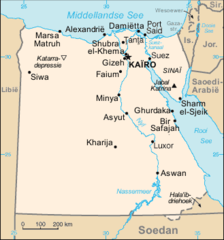
Kaart Egipte
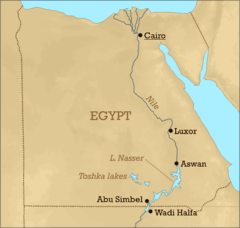
Lake Nasser Location
Location Map Egypt