Greece (Hellenic Republic), GR
Greece: Located in Southeast Europe, this country occupies the southern tip of the Balkan Peninsula, bordering the Aegean, Ionian, and Mediterranean Seas.
About

Country Snapshot
Hellenic Republic at a glance
Hellenic Republic currently has 618 quality-checked populated place pages and 0 state or regional pages linked on MapSof.
Mapped cities & towns
618
These counts use a stricter populated-place filter so the main lists stay focused on real city and town pages.
States & regions
0
Open related pagesLargest city
ChóraPopulation 6,434,501
Top linked places
Quick Facts about Hellenic Republic
| Population | 10,400,720 |
| Country | Greece |
| Plate code | GR |
| Area | 131957 km2 |
| Official name | Ελληνική Δημοκρατία, République hellénique, Ελλάδα |
| Has part | Greek Islands |
| Continent | Europe |
| Easternmost point | Point(26.63497925 41.38434357) |
| Northernmost point | Point(26.17 41.75) |
| Latitude & Longitude | 39.0000,22.0000 |
| Legislative body | Hellenic Parliament |
| Named for | Greeks |
| Official language | Demotic Greek, Greek |
| Capital | Athens, Nauplion |
| Establishment | April 06, 1821 (205 years ago) |
| Time Zone | Europe/Athens, Eastern European Summer Time, UTC+03:00, Eastern European Time, UTC+02:00 |
| Local time | 18:52:08 (24th July 2026) |

Geography
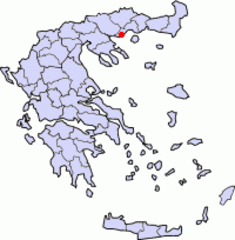
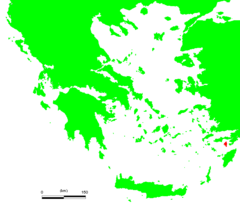
Hellenic Republic is located at 39°0'0"N 22°0'0"E (39.0000000, 22.0000000). It has 4 neighbors: Turkey, North Macedonia, Bulgaria and Albania.
Greece map
The largest city of Hellenic Republic is Athens with a population of 664,046. Other cities include, Thessaloníki population 315,196, Pátra population 168,034, Lárisa population 144,651 and Irákleion population 137,154. See all Hellenic Republic cities & populated places.
Official website of Hellenic Republic
Official WebsiteCompare Hellenic Republic with
- Mount Athos
- North Aegean Region
- Epirus Region
- South Aegean
- West Greece Region
- West Macedonia Region
- Ionian Islands Region
- Peloponnese Region
- Dodecanese
- Thessaly Region
- Centre Macedonia Region
- Central Greece Region
- East Macedonia and Thrace
- Attica Region
- Crete Region
Demographics
| Year | Population | % Change | Method |
|---|---|---|---|
| 1828 | 753,400 | - | census |
| 1856 | 1,062,627 | 29.1% | census |
| 1861 | 1,096,810 | 3.12% | census |
| 1896 | 2,443,806 | 55.12% | census |
| 1907 | 2,631,952 | 7.15% | census |
| 1920 | 5,536,375 | 52.46% | census |
| 1928 | 6,204,684 | 10.77% | census |
| 1940 | 7,344,860 | 15.52% | census |
| 1951 | 7,632,801 | 3.77% | census |
| 1960 | 8,331,725 | 8.39% | census |
| 1961 | 8,398,050 | 0.79% | 2011-01-01T00:00:00Z |
| 1962 | 8,448,233 | 0.59% | census |
| 1963 | 8,479,625 | 0.37% | 2011-01-01T00:00:00Z |
| 1964 | 8,510,429 | 0.36% | census |
| 1965 | 8,550,333 | 0.47% | 2011-01-01T00:00:00Z |
| 1966 | 8,613,651 | 0.74% | census |
| 1967 | 8,684,088 | 0.81% | 2011-01-01T00:00:00Z |
| 1968 | 8,740,765 | 0.65% | census |
| 1969 | 8,772,764 | 0.36% | estimation process |
| 1970 | 8,792,806 | 0.23% | census |
| 1971 | 8,831,036 | 0.43% | census |
| 1972 | 8,888,628 | 0.65% | 2011-01-01T00:00:00Z |
| 1973 | 8,929,086 | 0.45% | census |
| 1974 | 8,962,022 | 0.37% | census |
| 1975 | 9,046,541 | 0.93% | census |
| 1976 | 9,188,150 | 1.54% | census |
| 1977 | 9,308,479 | 1.29% | estimation process |
| 1978 | 9,429,959 | 1.29% | census |
| 1979 | 9,548,258 | 1.24% | census |
| 1980 | 9,642,505 | 0.98% | census |
| 1981 | 9,729,350 | 0.89% | census |
| 1982 | 9,789,513 | 0.61% | estimation process |
| 1983 | 9,846,627 | 0.58% | census |
| 1984 | 9,895,801 | 0.5% | 2011-01-01T00:00:00Z |
| 1985 | 9,934,300 | 0.39% | 2011-01-01T00:00:00Z |
| 1986 | 9,967,213 | 0.33% | census |
| 1987 | 10,000,595 | 0.33% | census |
| 1988 | 10,036,983 | 0.36% | census |
| 1989 | 10,089,498 | 0.52% | census |
| 1990 | 10,156,902 | 0.66% | census |
| 1991 | 10,256,292 | 0.97% | census |
| 1992 | 10,369,866 | 1.1% | census |
| 1993 | 10,465,528 | 0.91% | census |
| 1994 | 10,553,035 | 0.83% | census |
| 1995 | 10,634,385 | 0.76% | census |
| 1996 | 10,709,173 | 0.7% | census |
| 1997 | 10,776,504 | 0.62% | census |
| 1998 | 10,834,880 | 0.54% | census |
| 1999 | 10,882,580 | 0.44% | census |
| 2000 | 10,917,482 | 0.32% | census |
| 2001 | 10,951,764 | 0.31% | census |
| 2002 | 10,983,723 | 0.29% | census |
| 2003 | 11,018,324 | 0.31% | 2011-01-01T00:00:00Z |
| 2004 | 11,055,729 | 0.34% | census |
| 2005 | 11,092,913 | 0.34% | census |
| 2006 | 11,127,947 | 0.31% | estimation process |
| 2007 | 11,163,002 | 0.31% | census |
| 2008 | 11,186,439 | 0.21% | census |
| 2009 | 11,187,085 | 0.01% | census |
| 2010 | 11,153,454 | -0.3% | census |
| 2011 | 11,123,213 | -0.27% | census |
| 2012 | 11,092,771 | -0.27% | census |
| 2013 | 11,027,549 | -0.59% | census |
| 2014 | 10,775,557 | -2.34% | estimation process |
| 2015 | 10,820,883 | 0.42% | (Worldbank) |
| 2016 | 10,775,971 | -0.42% | (Worldbank) |
| 2017 | 10,760,421 | -0.14% | census |
| 2018 | 10,732,882 | -0.26% | (Worldbank) |
| 2019 | 10,716,322 | -0.15% | (Worldbank) |
| 2026 | 10,400,720 | -3.03% |
Map & Images (more maps)
Gr A2 Course
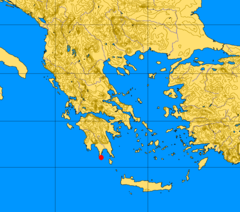
000 Greqia Harta
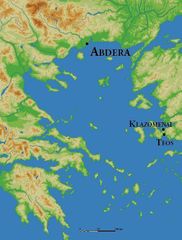
Abdera Location Alt
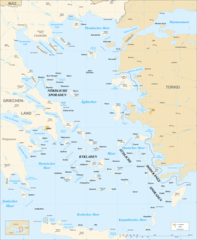
Aegean Sea Map De
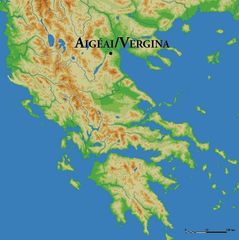
Aigeai Location
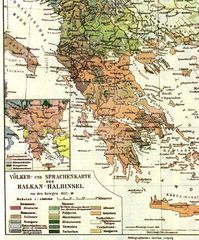
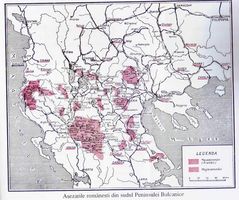
Balkan Sprachenkarte
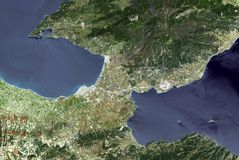
Cape Matapan
Carte Simi
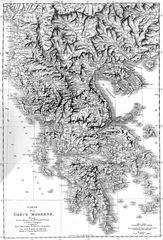
Carte Grece Moderne
Chania Municipalities Map
Copy of Nl26 1f (19)
Copy of Nl26 1f
Corinth, Greece (nasa)
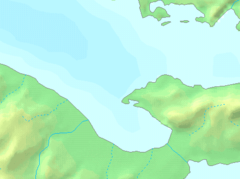
Corinth
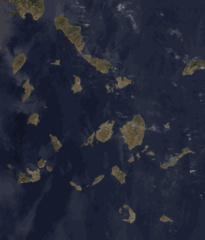
Cyclades Sat Blank
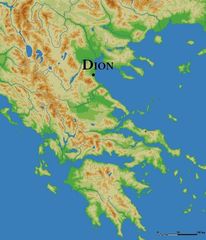
Dion Location
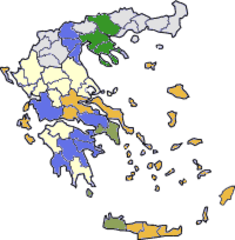
Divisions of Greece Progress
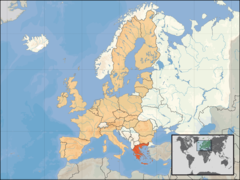
Eu Location Gre
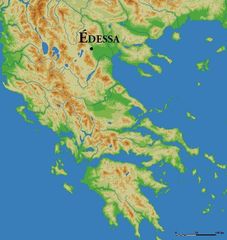
Edessa Location
Egine