Bulgaria (Republic of Bulgaria), BG
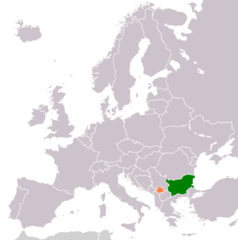
Bulgaria: Located in Southeast Europe, it borders the Black Sea to the east and is characterized by a diverse landscape including mountains, rivers, and a coastline.
About

Country Snapshot
Republic of Bulgaria at a glance
Republic of Bulgaria currently has 156 quality-checked populated place pages and 28 state or regional pages linked on MapSof.
Mapped cities & towns
156
These counts use a stricter populated-place filter so the main lists stay focused on real city and town pages.
States & regions
28
Open related pagesLargest city
SofiaPopulation 1,152,556
Top linked places
Quick Facts about Republic of Bulgaria
| Population | 6,437,360 |
| Country | Bulgaria |
| Plate code | BG |
| Area | 110993.6 km2 |
| Official name | la République de Bulgarie, Republiken Bulgarien, Bulharská republika, Republica Bulgaria, Република България |
| Continent | Europe |
| Easternmost point | Point(28.60926144 43.541729) |
| Northernmost point | Point(22.67 44.22) |
| Latitude & Longitude | 43.0000,25.0000 |
| Legislative body | National Assembly of Bulgaria |
| Named for | Bulgars |
| Official language | Bulgarian |
| Capital | Sofia |
| Time Zone | Europe/Sofia, UTC+02:00, Eastern European Time, Eastern European Summer Time, UTC+03:00 |
| Local time | 23:57:17 (18th July 2026) |

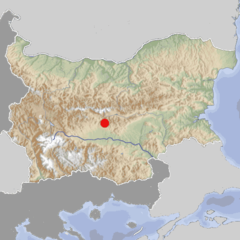
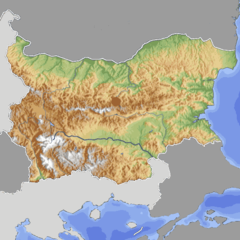
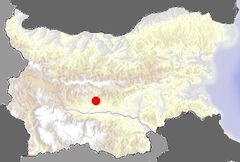
Geography
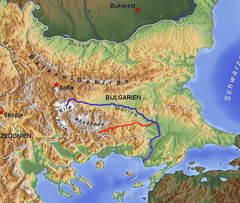
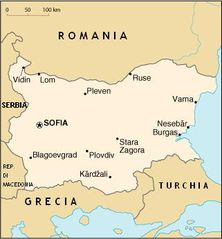
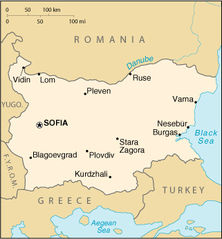
Republic of Bulgaria is located at 43°0'0"N 25°0'0"E (43.0, 25.0). It has 7 neighbors: Turkey, Greece, North Macedonia, Romania, Union, Serbia and Black Sea.
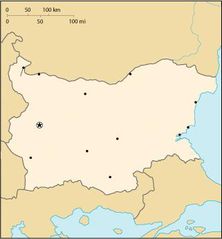
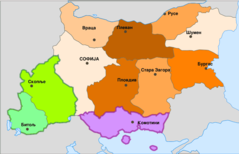
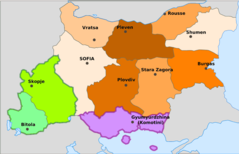
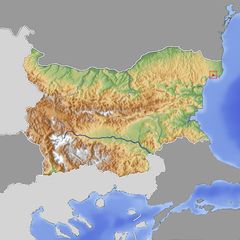
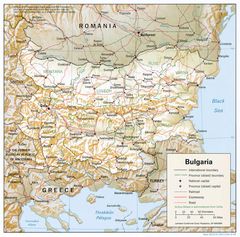
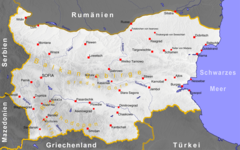
Bulgaria map
The largest city of Republic of Bulgaria is Sofia with a population of 1,152,556. Other cities include, Varna population 312,770, Burgas population 195,966, Ruse population 156,238 and Stara Zagora population 143,431. See all Republic of Bulgaria cities & populated places.
Compare Republic of Bulgaria with
- Varna Province
- Stara Zagora Province
- Pernik Province
- Targovishte Province
- Sofia Province
- Sliven Province
- Ruse Province
- Plovdiv region
- Pazardzhik Province
- Burgas Province
- Razgrad Province
- Gabrovo Province
- Kyustendil Province
- Vidin Province
- Haskovo Province
- Kardzhali Province
- Pleven Province
- Dobrich Province
- Smolyan Province
- Vratsa Province
- Sofia City Province
- Shumen Province
- Veliko Tarnovo Province
- Silistra Province
- Yambol Province
- Lovech Province
- Montana Province
- Blagoevgrad Province
Demographics
| Year | Population | % Change | Method |
|---|---|---|---|
| 1960 | 7,867,374 | - | census |
| 1961 | 7,943,118 | 0.95% | census |
| 1962 | 8,012,946 | 0.87% | census |
| 1963 | 8,078,145 | 0.81% | census |
| 1964 | 8,144,340 | 0.81% | census |
| 1965 | 8,204,168 | 0.73% | census |
| 1966 | 8,258,057 | 0.65% | census |
| 1967 | 8,310,226 | 0.63% | census |
| 1968 | 8,369,603 | 0.71% | census |
| 1969 | 8,434,172 | 0.77% | census |
| 1970 | 8,489,574 | 0.65% | census |
| 1971 | 8,536,395 | 0.55% | census |
| 1972 | 8,576,200 | 0.46% | census |
| 1973 | 8,620,967 | 0.52% | census |
| 1974 | 8,678,745 | 0.67% | census |
| 1975 | 8,720,742 | 0.48% | census |
| 1976 | 8,758,599 | 0.43% | census |
| 1977 | 8,804,183 | 0.52% | census |
| 1978 | 8,814,032 | 0.11% | census |
| 1979 | 8,825,940 | 0.13% | census |
| 1980 | 8,861,535 | 0.4% | census |
| 1981 | 8,891,117 | 0.33% | census |
| 1982 | 8,917,457 | 0.3% | census |
| 1983 | 8,939,738 | 0.25% | census |
| 1984 | 8,960,679 | 0.23% | census |
| 1985 | 8,960,547 | -0% | census |
| 1986 | 8,958,171 | -0.03% | census |
| 1987 | 8,971,359 | 0.15% | census |
| 1988 | 8,981,446 | 0.11% | census |
| 1989 | 8,876,972 | -1.18% | census |
| 1990 | 8,718,289 | -1.82% | census |
| 1991 | 8,632,367 | -1% | census |
| 1992 | 8,540,164 | -1.08% | census |
| 1993 | 8,472,313 | -0.8% | census |
| 1994 | 8,443,591 | -0.34% | census |
| 1995 | 8,406,067 | -0.45% | census |
| 1996 | 8,362,826 | -0.52% | census |
| 1997 | 8,312,068 | -0.61% | census |
| 1998 | 8,256,786 | -0.67% | census |
| 1999 | 8,210,624 | -0.56% | census |
| 2000 | 8,170,172 | -0.5% | census |
| 2001 | 8,020,282 | -1.87% | census |
| 2002 | 7,868,468 | -1.93% | census |
| 2003 | 7,823,557 | -0.57% | census |
| 2004 | 7,781,161 | -0.54% | census |
| 2005 | 7,739,900 | -0.53% | census |
| 2006 | 7,699,020 | -0.53% | census |
| 2007 | 7,545,338 | -2.04% | census |
| 2008 | 7,492,561 | -0.7% | census |
| 2009 | 7,444,443 | -0.65% | census |
| 2010 | 7,395,599 | -0.66% | census |
| 2011 | 7,348,328 | -0.64% | census |
| 2012 | 7,305,888 | -0.58% | census |
| 2013 | 7,265,115 | -0.56% | census |
| 2014 | 7,223,938 | -0.57% | (Worldbank) |
| 2015 | 7,177,991 | -0.64% | (Worldbank) |
| 2016 | 7,127,822 | -0.7% | census |
| 2017 | 7,075,991 | -0.73% | census |
| 2018 | 7,025,037 | -0.73% | (Worldbank) |
| 2019 | 6,951,482 | -1.06% | census |
| 2026 | 6,437,360 | -7.99% |
Map & Images (more maps)
000 Bullgaria Harta
Administrative Map of Bulgaria During Wwii Sr
Administrative Map of Bulgaria During Wwii
Arda Mariza
Bg Topo600x600 11
Bg Topo600x600 12
Bg Topo600x600 13
Bg Topo600x600 18
Bg Topo600x600 19
Bg Topo600x600 8

Bgbalkangebirge2
Bgbalkangebirge2 3
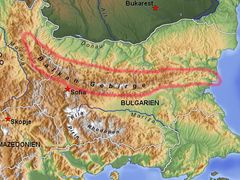
Balkangebirge Balkan Topo De
Baltschik Bg City Vorschlag
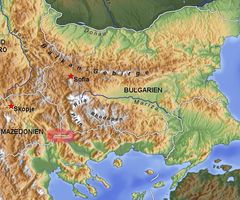
Belasiza Balkan Topo De
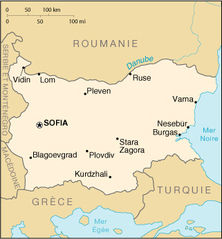
Bu Map Fr
Bu Map It
Bu Map
Bulgaria 1994 Cia Map
Bulgaria Cities Map German