Uruguay (Oriental Republic of Uruguay), UY
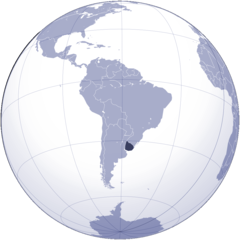
Uruguay: Located in the southeastern part of South America, bordering the Atlantic Ocean, Argentina, and Brazil, this republic is characterized by its fertile plains and a coastline adorned with popular resorts.
About

Country Snapshot
Oriental Republic of Uruguay at a glance
Oriental Republic of Uruguay currently has 76 quality-checked populated place pages and 19 state or regional pages linked on MapSof.
Mapped cities & towns
76
These counts use a stricter populated-place filter so the main lists stay focused on real city and town pages.
States & regions
19
Open related pagesLargest city
FloridaPopulation 21,733,312
Top linked places
Quick Facts about Oriental Republic of Uruguay
| Population | 3,499,451 |
| Country | Uruguay |
| Plate code | UY |
| Phone Area Codes | +598 |
| Area | 176215 km2 |
| Official name | la République orientale de l’Uruguay, Uruguay |
| Continent | South America |
| Easternmost point | Point(-53.18464279 -32.65440712) |
| Northernmost point | Point(-57.0 -30.08) |
| Latitude & Longitude | -33.0000,-56.0000 |
| Legislative body | General Assembly of Uruguay |
| Named for | Uruguay River |
| Official language | Spanish |
| Capital | Montevideo |
| Establishment | January 01, 1825 (201 years ago) |
| Time Zone | UTC−02:00, UTC−03:00 |
| Local time | 07:11:21 (14th July 2026) |

Geography
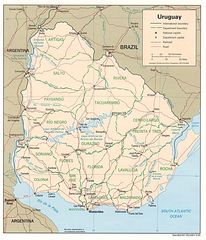
Oriental Republic of Uruguay is located at 33°0'0"S 56°0'0"W (-33.0, -56.0). It has 2 neighbors: Brazil and Argentina.
Uruguay map
The largest city of Oriental Republic of Uruguay is Montevideo with a population of 1,270,737. Other cities include, Salto population 99,823, Paysandú population 73,249, Maldonado population 55,478 and Minas population 38,025. See all Oriental Republic of Uruguay cities & populated places.
Official website of Oriental Republic of Uruguay
Official WebsiteCompare Oriental Republic of Uruguay with
- Soriano Department
- Durazno Department
- Cerro Largo Department
- Paysandú Department
- Colonia Department
- San José Department
- Maldonado Department
- Canelones Department
- departamento de canelones
- Río Negro Department
- Rivera Department
- Treinta y Tres Department
- Artigas Department
- Flores Department
- Salto Department
- Florida Department
- Lavalleja Department
- Tacuarembó Department
- Rocha Department
Demographics
| Year | Population | % Change | Method |
|---|---|---|---|
| 1960 | 2,538,779 | - | census |
| 1961 | 2,571,834 | 1.29% | census |
| 1962 | 2,604,042 | 1.24% | census |
| 1963 | 2,635,294 | 1.19% | census |
| 1964 | 2,665,561 | 1.14% | census |
| 1965 | 2,694,714 | 1.08% | census |
| 1966 | 2,723,055 | 1.04% | census |
| 1967 | 2,750,273 | 0.99% | census |
| 1968 | 2,774,949 | 0.89% | census |
| 1969 | 2,795,223 | 0.73% | census |
| 1970 | 2,809,981 | 0.53% | census |
| 1971 | 2,818,462 | 0.3% | census |
| 1972 | 2,821,645 | 0.11% | census |
| 1973 | 2,822,306 | 0.02% | census |
| 1974 | 2,824,291 | 0.07% | census |
| 1975 | 2,830,378 | 0.22% | census |
| 1976 | 2,841,603 | 0.4% | census |
| 1977 | 2,857,218 | 0.55% | census |
| 1978 | 2,876,019 | 0.65% | census |
| 1979 | 2,896,016 | 0.69% | census |
| 1980 | 2,915,735 | 0.68% | census |
| 1981 | 2,934,985 | 0.66% | census |
| 1982 | 2,954,236 | 0.65% | census |
| 1983 | 2,973,436 | 0.65% | census |
| 1984 | 2,992,644 | 0.64% | census |
| 1985 | 3,011,918 | 0.64% | census |
| 1986 | 3,031,053 | 0.63% | census |
| 1987 | 3,049,987 | 0.62% | census |
| 1988 | 3,069,112 | 0.62% | census |
| 1989 | 3,088,980 | 0.64% | census |
| 1990 | 3,109,941 | 0.67% | census |
| 1991 | 3,131,936 | 0.7% | census |
| 1992 | 3,154,657 | 0.72% | census |
| 1993 | 3,177,867 | 0.73% | census |
| 1994 | 3,201,235 | 0.73% | census |
| 1995 | 3,224,383 | 0.72% | census |
| 1996 | 3,247,585 | 0.71% | census |
| 1997 | 3,270,549 | 0.7% | census |
| 1998 | 3,291,677 | 0.64% | census |
| 1999 | 3,308,884 | 0.52% | census |
| 2000 | 3,320,841 | 0.36% | census |
| 2001 | 3,326,762 | 0.18% | census |
| 2002 | 3,327,500 | 0.02% | census |
| 2003 | 3,325,411 | -0.06% | census |
| 2004 | 3,323,822 | -0.05% | census |
| 2005 | 3,325,155 | 0.04% | census |
| 2006 | 3,330,217 | 0.15% | census |
| 2007 | 3,338,384 | 0.24% | census |
| 2008 | 3,348,898 | 0.31% | census |
| 2009 | 3,360,431 | 0.34% | census |
| 2010 | 3,371,982 | 0.34% | census |
| 2011 | 3,383,486 | 0.34% | census |
| 2012 | 3,395,253 | 0.35% | census |
| 2013 | 3,407,062 | 0.35% | census |
| 2014 | 3,400,434 | -0.19% | (Worldbank) |
| 2015 | 3,412,009 | 0.34% | (Worldbank) |
| 2016 | 3,424,132 | 0.35% | (Worldbank) |
| 2017 | 3,456,750 | 0.94% | census |
| 2018 | 3,449,299 | -0.22% | (Worldbank) |
| 2019 | 3,461,734 | 0.36% | (Worldbank) |
| 2026 | 3,499,451 | 1.08% |
Map & Images (more maps)
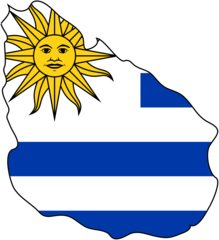
Uruguay Flag Map
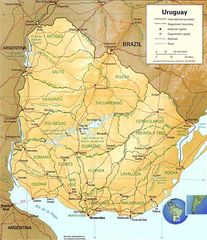
Uruguay Map
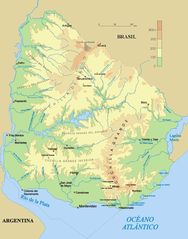
Uruguay Physical
Uruguay Political Map 1995