South Shore, South Dakota
South Shore: town of the United States
About
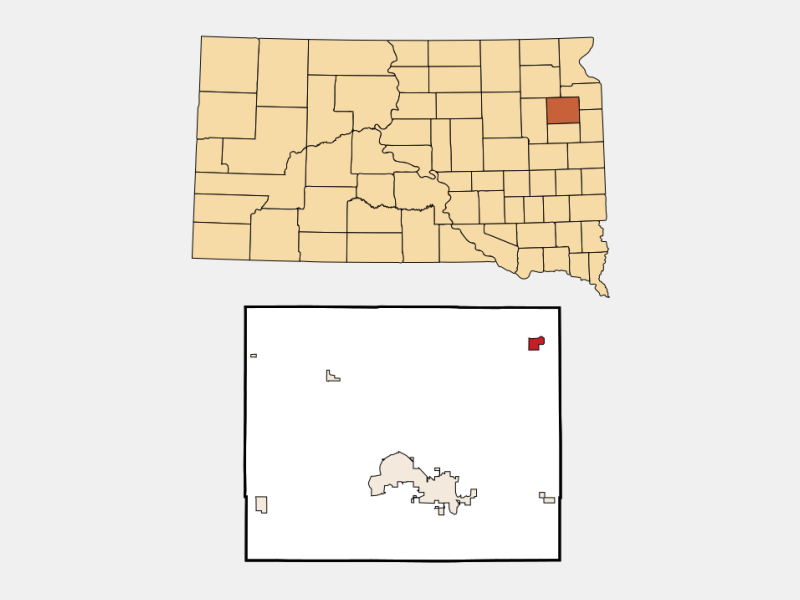
South Shore is a town located in the county of Codington in the U.S. state of South Dakota. Its population at the 2010 census was 225 and a population density of 62 people per km². After 10 years in 2020 city had an estimated population of 215 inhabitants.
Quick Facts about South Shore
| Population | 215 (2020) |
| Country | United States of America |
| State | South Dakota (United States) |
| County | Codington County |
| Postal code | 57263 |
| Phone Area Codes | 605 |
| Area | 3.62 km2 |
| Latitude & Longitude | 45.1058,-96.9287 |
| Altitude | 1,877 feet / 572 meters |
| Time Zone | America/Chicago |
| Local time | 09:40:26 (24th July 2026) |
| Density | 59 Pop. per km² as of 2020 |
| Population growth | -4.65% (2010-2020) |
| Weather | 84℉ Mostly Sunny 7-days weather |
Geography
South Shore is located at 45°6'21"N 96°55'43"W (45.1058000, -96.9286800).
South Shore map
Weather
Mostly sunny, with a high near 84. South southwest wind around 15 mph, with gusts as high as 25 mph.
7-Day ForecastDemographics
According to census records, the population of South Shore decreased by 4.65% in 10 years.
| Year | Population | % Change | Method |
|---|---|---|---|
| 2010 | 225 | - | census |
| 2011 | 226 | 0.44% | estimation process |
| 2012 | 226 | 0% | estimation process |
| 2013 | 226 | 0% | estimation process |
| 2014 | 224 | -0.89% | estimation process |
| 2015 | 221 | -1.36% | estimation process |
| 2016 | 222 | 0.45% | estimation process |
| 2017 | 220 | -0.91% | estimation process |
| 2018 | 218 | -0.92% | estimation process |
| 2019 | 215 | -1.4% | estimation process |
| 2020 | 215 | 0% | estimation process |
Demographic Facts
| Estimated population as of July 1, 2019 : | 8,125 |
| Based on demographic estimates as of April 1, 2010 : | 8,343 |
| Based on demographic estimates as of 1 April 2010 : | -2.6% |
| April 1, 2020 Population : | 8,579 |
| April 1, 2010 Population : | 8,338 |
| People under 5 years old, percentage : | 6.9% |
| People under 18 years old, percentage : | 24.7% |
| People over 65 (%) : | 14.6% |
| Female persons, % : | 53.4% |
| White only, percent : | 92.7% |
| Black or African American alone, percent : | 1.2% |
| American Indian and Alaska Native only, % : | 0.6% |
| Asians alone % : | 1.0% |
| Only Native Hawaiians and Other Pacific Islanders, % : | 0.3% |
| % of people who have participated in two or more races : | 2.6% |
| % of Hispanic or Latino : | 3.6% |
| White people, not Hispanic or Latino people, make up the majority of the population. : | 91.1% |
| 2015-2019 Veterans : | 502 |
| Percentage of foreign-born people, 2015-2019 : | 1.9% |
| Rate of owner-occupied housing units, 2015-2019 : | 45.3% |
Economic Facts
| Rate of owner-occupied housing units, 2015-2019 : | 45.3% |
| Owner-occupied housing unit median value, 2015-2019 : | $74,600 |
| From 2015 to 2019, the median selected monthly owner costs - with a mortgage : | $934 |
| Monthly owner costs, without a mortgage, at the median, 2015-2019 : | $500 |
| 2015-2019 median gross rent : | $649 |
| 2015-2019 Households : | 3,726 |
| Population per household, 2015-2019 : | 2.15 |
| Living in the same house a year ago, percentage of people aged one year and up, 2015-2019 : | 82.3% |
| Languages other than English spoken at home, as a percentage of people aged 5 and up, 2015-2019 : | 4.4% |
| Households with computers, %, 2015-2019 : | 80.6% |
| Percentage of households with a broadband Internet subscription, 2015-2019 : | 70.9% |
| Percentage of people aged 25 and up with a high school diploma or higher, 2015-2019 : | 86.6% |
| Bachelor's degree or higher, proportion of people aged 25 and up, 2015-2019 : | 7.6% |
| Percentage of people under the age of 65 who have a disability, 2015-2019 : | 15.7% |
| Persons under the age of 65 who do not have health insurance, as a percentage : | 7.3% |
| Total civilian labor force, percent of population aged 16 and up, 2015-2019 : | 62.3% |
| Female labor force participation in the civilian labor force, as a percentage of the population aged 16 and up, 2015-2019 : | 60.9% |
| Total sales of lodging and food services in 2012 ($1,000) : | 9,010 |
| Total receipts/revenue for health care and social assistance in 2012 ($1,000) : | 68,348 |
| Manufacturers' total shipments in 2012 ($1,000) : | 464,774 |
| 2012 total retail sales ($1,000) : | 282,632 |
| 2012 total retail sales per capita : | $33,808 |
| Mean commute time to work (in minutes), workers aged 16 and up, 2015-2019 : | 20.2 |
| 2015-2019 median household income (in 2019 dollars) : | $35,573 |
| Income per capita in the previous 12 months (in 2019 dollars), 2015-2019 : | $21,561 |
| Percentage of people living in poverty : | 21.5% |
| Total number of businesses in 2012 : | 581 |
| Men-owned businesses in 2012 : | 321 |
| Women-owned businesses in 2012 : | 91 |
| Minority-owned businesses in 2012 : | F |
| Non-minority-owned businesses in 2012 : | 512 |
| Veteran-owned businesses in 2012 : | 63 |
| Nonveteran-owned businesses in 2012 : | 465 |
| 2010 population per square mile : | 4,106.7 |
| 2010 land area in square miles : | 2.03 |
| Rate of owner-occupied housing units, 2015-2019 : | 50.3% |
| Owner-occupied housing unit median value, 2015-2019 : | $48,000 |
| From 2015 to 2019, the median selected monthly owner costs - with a mortgage : | $808 |
| Monthly owner costs, without a mortgage, at the median, 2015-2019 : | $373 |
| 2015-2019 median gross rent : | $634 |
| 2015-2019 Households : | 8,930 |
| Population per household, 2015-2019 : | 2.05 |
| Living in the same house a year ago, percentage of people aged one year and up, 2015-2019 : | 88.9% |
| Languages other than English spoken at home, as a percentage of people aged 5 and up, 2015-2019 : | 3.0% |
| Households with computers, %, 2015-2019 : | 79.1% |
| Percentage of households with a broadband Internet subscription, 2015-2019 : | 68.9% |
| Percentage of people aged 25 and up with a high school diploma or higher, 2015-2019 : | 88.2% |
| Bachelor's degree or higher, proportion of people aged 25 and up, 2015-2019 : | 13.1% |
| Percentage of people under the age of 65 who have a disability, 2015-2019 : | 20.0% |
| Persons under the age of 65 who do not have health insurance, as a percentage : | 8.3% |
| Total civilian labor force, percent of population aged 16 and up, 2015-2019 : | 55.5% |
| Female labor force participation in the civilian labor force, as a percentage of the population aged 16 and up, 2015-2019 : | 54.5% |
| Total sales of lodging and food services in 2012 ($1,000) : | 17,100 |
| Total receipts/revenue for health care and social assistance in 2012 ($1,000) : | 281,195 |
| Manufacturers' total shipments in 2012 ($1,000) : | 70,073 |
| 2012 total retail sales ($1,000) : | 267,709 |
| 2012 total retail sales per capita : | $13,599 |
| Mean commute time to work (in minutes), workers aged 16 and up, 2015-2019 : | 29.7 |
| 2015-2019 median household income (in 2019 dollars) : | $29,094 |
| Income per capita in the previous 12 months (in 2019 dollars), 2015-2019 : | $21,047 |
| Percentage of people living in poverty : | 31.4% |
| Total number of businesses in 2012 : | 1,001 |
| Men-owned businesses in 2012 : | 417 |
| Women-owned businesses in 2012 : | 411 |
| Minority-owned businesses in 2012 : | 315 |
| Non-minority-owned businesses in 2012 : | 599 |
| Veteran-owned businesses in 2012 : | 128 |
| Nonveteran-owned businesses in 2012 : | 707 |
| 2010 population per square mile : | 3,911.5 |
| 2010 land area in square miles : | 5.04 |
Nearby Schools and Colleges
Schools and campuses linked to South Shore, SD. Select a name to open its map and contact details.
| Code | Name | City | ZIP |
|---|---|---|---|
| 219143 | Lake Area Technical College | Watertown (SD) | 57201-0730 |
Closest post offices linked to South Shore.
| Post Office Name | City | ZIP |
|---|---|---|
| South Shor Post Office | South Shore (SD) | 57263 |
| Stockholm Post Office | Stockholm (SD) | 57264 |
| Twin Brook Post Office | Twin Brooks (SD) | 57269 |
| Marvin Post Office | Marvin (SD) | 57251 |
| Summ Post Office | Summit (SD) | 57266 |
Other places with the same name (1)
- South Shore, Kentucky City in Greenup County, Kentucky, United States with a population of 1,049 people.
Other cities in Codington County
Cities, towns, neighborhoods & other populated places in Codington County , SD.
| City Name | Population | Title |
|---|---|---|
| Watertown | 22,303 | City in and county seat of Codington County, South Dakota, United States |
| Kranzburg | 364 | Township in Codington County, South Dakota |
| Kampeska | 333 | Township in Codington County, South Dakota |
| Rauville | 293 | Township in Codington County, South Dakota |
| Henry | 100 | Town in Coddington County, South Dakota, United States |
| Wallace | 87 | Town in South Dakota, United States of America |
| Waverly | 62 | Census-designated place in Codington County, South Dakota |
| Florence | 18 | Town in Codington County, South Dakota, United States |