Ocean City, New Jersey
Ocean City: city in New Jersey
About
Ocean City is a city located in the county of Cape May in the U.S. state of New Jersey. Its population at the 2010 census was 11,701. After 9 years in 2019 city had an estimated population of 10,971 inhabitants.
The city was created 142 years ago in 1884.

Quick Facts about Ocean City
| Population | 10,971 (2019) |
| Country | United States of America |
| State | New Jersey (United States) |
| County | Cape May County |
| Postal code | 08226 |
| Phone Area Codes | 609 |
| Area | 27964101 km2 |
| Latitude & Longitude | 39.2776,-74.5746 |
| Altitude | 3 feet / 1 meters |
| Establishment | May 03, 1884 (142 years ago) |
| Time Zone | Eastern Time Zone |
| Local time | 13:08:32 (17th July 2026) |
| Population growth | -6.65% (2010-2019) |

Geography
Ocean City is located at 39°16'39"N 74°34'29"W (39.2776200, -74.5746000). It has 2 neighbors: Township of Egg Harbor and Somers Point.
Ocean City map
Official website of Ocean City
Official WebsiteDemographics
According to census records, the population of Ocean City decreased by 6.65% in 9 years.
| Year | Population | % Change | Method |
|---|---|---|---|
| 2010 | 11,701 | - | census |
| 2011 | 11,604 | -0.84% | estimation process |
| 2012 | 11,551 | -0.46% | estimation process |
| 2013 | 11,417 | -1.17% | estimation process |
| 2014 | 11,328 | -0.79% | estimation process |
| 2015 | 11,281 | -0.42% | estimation process |
| 2016 | 11,245 | -0.32% | estimation process |
| 2017 | 11,155 | -0.81% | estimation process |
| 2018 | 11,027 | -1.16% | estimation process |
| 2019 | 10,971 | -0.51% | estimation process |
Demographic Facts
| Estimated population as of July 1, 2019 : | 7,078 |
| Based on demographic estimates as of April 1, 2010 : | 7,477 |
| Based on demographic estimates as of 1 April 2010 : | -5.3% |
| April 1, 2020 Population : | 7,118 |
| April 1, 2010 Population : | 7,477 |
| People under 5 years old, percentage : | 5.5% |
| People under 18 years old, percentage : | 26.0% |
| People over 65 (%) : | 17.3% |
| Female persons, % : | 53.0% |
| White only, percent : | 47.5% |
| Black or African American alone, percent : | 47.5% |
| American Indian and Alaska Native only, % : | 1.2% |
| Asians alone % : | 0.6% |
| Only Native Hawaiians and Other Pacific Islanders, % : | 0.0% |
| % of people who have participated in two or more races : | 2.4% |
| % of Hispanic or Latino : | 5.9% |
| White people, not Hispanic or Latino people, make up the majority of the population. : | 42.3% |
| 2015-2019 Veterans : | 325 |
| Percentage of foreign-born people, 2015-2019 : | 4.1% |
| Rate of owner-occupied housing units, 2015-2019 : | 55.7% |
Economic Facts
| Rate of owner-occupied housing units, 2015-2019 : | 55.7% |
| Owner-occupied housing unit median value, 2015-2019 : | $80,600 |
| From 2015 to 2019, the median selected monthly owner costs - with a mortgage : | $1,033 |
| Monthly owner costs, without a mortgage, at the median, 2015-2019 : | $297 |
| 2015-2019 median gross rent : | $755 |
| 2015-2019 Households : | 2,836 |
| Population per household, 2015-2019 : | 2.46 |
| Living in the same house a year ago, percentage of people aged one year and up, 2015-2019 : | 83.5% |
| Languages other than English spoken at home, as a percentage of people aged 5 and up, 2015-2019 : | 6.1% |
| Households with computers, %, 2015-2019 : | 82.1% |
| Percentage of households with a broadband Internet subscription, 2015-2019 : | 67.5% |
| Percentage of people aged 25 and up with a high school diploma or higher, 2015-2019 : | 80.3% |
| Bachelor's degree or higher, proportion of people aged 25 and up, 2015-2019 : | 16.3% |
| Percentage of people under the age of 65 who have a disability, 2015-2019 : | 19.6% |
| Persons under the age of 65 who do not have health insurance, as a percentage : | 13.6% |
| Total civilian labor force, percent of population aged 16 and up, 2015-2019 : | 53.6% |
| Female labor force participation in the civilian labor force, as a percentage of the population aged 16 and up, 2015-2019 : | 55.1% |
| 2012 total retail sales ($1,000) : | 279,761 |
| 2012 total retail sales per capita : | $37,386 |
| Mean commute time to work (in minutes), workers aged 16 and up, 2015-2019 : | 21.7 |
| 2015-2019 median household income (in 2019 dollars) : | $32,818 |
| Income per capita in the previous 12 months (in 2019 dollars), 2015-2019 : | $19,274 |
| Percentage of people living in poverty : | 31.0% |
| Total number of businesses in 2012 : | 1,243 |
| Men-owned businesses in 2012 : | 790 |
| Women-owned businesses in 2012 : | 326 |
| Minority-owned businesses in 2012 : | 206 |
| Non-minority-owned businesses in 2012 : | 978 |
| Veteran-owned businesses in 2012 : | 92 |
| Nonveteran-owned businesses in 2012 : | 1,063 |
| 2010 population per square mile : | 612.4 |
| 2010 land area in square miles : | 12.21 |
| Residential units, July 1, 2019 : | 15,188 |
| Rate of owner-occupied housing units, 2015-2019 : | 69.6% |
| Owner-occupied housing unit median value, 2015-2019 : | $83,300 |
| From 2015 to 2019, the median selected monthly owner costs - with a mortgage : | $1,039 |
| Monthly owner costs, without a mortgage, at the median, 2015-2019 : | $366 |
| 2015-2019 median gross rent : | $679 |
| Permits for construction, 2020 : | 11 |
| 2015-2019 Households : | 12,488 |
| Population per household, 2015-2019 : | 2.72 |
| Living in the same house a year ago, percentage of people aged one year and up, 2015-2019 : | 90.0% |
| Languages other than English spoken at home, as a percentage of people aged 5 and up, 2015-2019 : | 1.8% |
| Households with computers, %, 2015-2019 : | 79.7% |
| Percentage of households with a broadband Internet subscription, 2015-2019 : | 59.8% |
| Percentage of people aged 25 and up with a high school diploma or higher, 2015-2019 : | 80.6% |
| Bachelor's degree or higher, proportion of people aged 25 and up, 2015-2019 : | 14.9% |
| Percentage of people under the age of 65 who have a disability, 2015-2019 : | 13.6% |
| Persons under the age of 65 who do not have health insurance, as a percentage : | 16.3% |
| Total civilian labor force, percent of population aged 16 and up, 2015-2019 : | 51.6% |
| Female labor force participation in the civilian labor force, as a percentage of the population aged 16 and up, 2015-2019 : | 49.8% |
| Total sales of lodging and food services in 2012 ($1,000) : | 42,743 |
| Total receipts/revenue for health care and social assistance in 2012 ($1,000) : | 136,415 |
| Manufacturers' total shipments in 2012 ($1,000) : | 631,469 |
| 2012 total retail sales ($1,000) : | 471,778 |
| 2012 total retail sales per capita : | $13,685 |
| Mean commute time to work (in minutes), workers aged 16 and up, 2015-2019 : | 25.4 |
| 2015-2019 median household income (in 2019 dollars) : | $38,304 |
| Income per capita in the previous 12 months (in 2019 dollars), 2015-2019 : | $19,892 |
| Percentage of people living in poverty : | 22.8% |
| Total number of employer establishments, 2019 : | 583 |
| 2019 total employment : | 8,582 |
| 2019 total annual payroll ($1,000) : | 311,451 |
| Total employment, change in percentage terms, 2018-2019 : | -1.4% |
| 2018 total non-employer establishments : | 2,745 |
| Total number of businesses in 2012 : | 2,900 |
| Men-owned businesses in 2012 : | 1,512 |
| Women-owned businesses in 2012 : | 1,106 |
| Minority-owned businesses in 2012 : | 1,194 |
| Non-minority-owned businesses in 2012 : | 1,574 |
| Veteran-owned businesses in 2012 : | 320 |
| Nonveteran-owned businesses in 2012 : | 2,450 |
| 2010 population per square mile : | 50.7 |
| 2010 land area in square miles : | 685.14 |
Best Things to Do in Ocean City
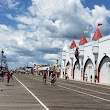
1Ocean City Boardwalk
400 Boardwalk, Ocean City, NJ 08226, United States View details
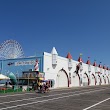
2Gillian's Wonderland Pier
600 Boardwalk, Ocean City, NJ 08226, United States View details
Phone: +16093997082 | Website available
3Playland's Castaway Cove
1020 Boardwalk, Ocean City, NJ 08226, United States View details
Phone: +16093994751 | Website available

4OC Waterpark
728 Boardwalk, Ocean City, NJ 08226, United States View details
Phone: +16093990483 | Website available

5Haunted Golf
824 Boardwalk, Ocean City, NJ 08226, United States View details
Phone: +16093917777 | Website available

Services and Civic Places in Ocean City
1City of Ocean City, City Hall 1914
861 Asbury Ave, Ocean City, NJ 08226 View details
Phone: +16093996111 | Website available

People born in Ocean City (16)
People born in Ocean City, including writer Gay Talese, musician Walter Trout, actor Keith Andes, .
More notable people
- Ben Bourgeois (American surfer) he was born in 30/10/1978
- Marla Adams (American actress) she was born in 28/08/1938
- Frank J. Esposito (American historian) he was born in 09/06/1941
- Harry Smith (former U.S. soccer full back, 1907) he was born in 14/03/1907
- Jamie Ginn (American beauty pageant contestant) she was born in 07/01/1982
- Kurt Loder (American journalist) he was born in 05/05/1945
- Maurice Catarcio (American professional wrestler) he was born in 21/03/1929
- Michael Lombardi (American sports player, executive, and journalist) he was born in 19/06/1959
- Stephanie Gaitley (American basketball coach) she was born in 25/01/1960
- Thomas J. Shusted he was born in 03/08/1926
- Clare Quilty (character from Vladimir Nabokov's Lolita) he was born in 01/01/1911
- Tom Gustafson he was born in 09/10/1949
- Mick Lombardi he was born in 01/10/1988
Nearby Schools and Colleges
Schools and campuses linked to Ocean City, NJ. Select a name to open its map and contact details.
| Code | Name | City | ZIP |
|---|---|---|---|
| 448983 | Harris School of Business-Linwood Campus | Linwood (NJ) | 08221 |
Nearby Transit Stations (20)
Rail and bus stations connected to Ocean City, NJ. Select a station to open its map and address details.
| Code | Name | Address | Type |
|---|---|---|---|
| ACY | Atlantic City Rail Terminal | 1 Atlantic City Expressway | OTHER |
| ABN | Absecon | Shore Road and Ohio Ave | OTHER |
| EGH | Egg Harbor City, New Jersey | South Philadelphia Ave & Atlantic Ave | OTHER |
| HTN | Hammonton, New Jersey | Egg Harbor Rd & Line St. | OTHER |
| ATO | Atco, New Jersey | Cooper Rd and Raritan Ave | OTHER |
Closest post offices linked to Ocean City.
| Post Office Name | City | ZIP |
|---|---|---|
| Ocean City Post Office | Ocean City (NJ) | 08226 |
Other places with the same name (1)
- Ocean City, Maryland town in Worcester County, Maryland, United States with a population of 6,913 people.
Other cities in Cape May County
Cities, towns, neighborhoods & other populated places in Cape May County , NJ. (more)
| City Name | Population | Title |
|---|---|---|
| Middletown | 65,190 | Township in Monmouth County, New Jersey, United States |
| Cedar Grove | 12,796 | Township in Essex County, New Jersey |
| Tabernacle | 6,782 | Township of New Jersey |
| Cape May Court House | 5,338 | Census-designated place in Middle Township, Cape May County, New Jersey |
| Wildwood | 4,916 | City in New Jersey |
| North Wildwood | 3,739 | City in Cape May County, New Jersey, United States |
| Cape May | 3,404 | City in New Jersey |
| North Cape May | 3,226 | Census designated place |
| Wildwood Crest | 3,033 | Borough in New Jersey, United States |
| Woodbine | 2,410 | City in Camden County, Georgia, USA |
| Erma | 2,134 | Census designated place |
| Sea Isle City | 2,029 | City in Cape May County, New Jersey, United States |
| Avalon | 1,219 | Borough in Cape May County, New Jersey, United States of America |
| West Cape May | 991 | Borough in Cape May County, New Jersey, United States |
| Stone Harbor | 805 | Borough of New Jersey |
| West Wildwood | 540 | Borough of New Jersey, United States |
Distance to Other Cities
Ocean City distances to largest New Jersey cities