New Harmony, Indiana
New Harmony: human settlement in Posey County, Indiana, United States of America
About
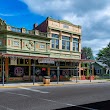
New Harmony is a city located in the county of Posey in the U.S. state of Indiana. Its population at the 2010 census was 789 and a population density of 469 people per km². After 10 years in 2020 city had an estimated population of 747 inhabitants.
The city was created 212 years ago in 1813.
Quick Facts about New Harmony
| Population | 747 (2020) |
| Country | United States of America |
| State | Indiana (United States) |
| County | Posey County |
| Postal code | 47631 |
| Phone Area Codes | 812 |
| Area | 1.68 km2 |
| Latitude & Longitude | 38.1298,-87.9350 |
| Altitude | 5,059 feet / 1542 meters |
| Establishment | January 01, 1814 (212 years ago) |
| Time Zone | America/Chicago |
| Local time | 04:07:20 (28th June 2026) |
| Density | 444 Pop. per km² as of 2020 |
| Population growth | -5.62% (2010-2020) |
| Weather | 90℉ Slight Chance Showers And Thunderstorms then Mostly Sunny 7-days weather |
Geography
New Harmony is located at 38°7'47"N 87°56'6"W (38.1297700, -87.9350300).
New Harmony map
Weather
A slight chance of showers and thunderstorms before 9am. Mostly sunny, with a high near 90. South southwest wind 2 to 7 mph. Chance of precipitation i...
7-Day ForecastOfficial website of New Harmony
Official WebsiteDemographics
According to census records, the population of New Harmony decreased by 5.62% in 10 years.
| Year | Population | % Change | Method |
|---|---|---|---|
| 2010 | 789 | - | census |
| 2011 | 781 | -1.02% | estimation process |
| 2012 | 778 | -0.39% | estimation process |
| 2013 | 770 | -1.04% | estimation process |
| 2014 | 769 | -0.13% | estimation process |
| 2015 | 768 | -0.13% | estimation process |
| 2016 | 766 | -0.26% | estimation process |
| 2017 | 763 | -0.39% | estimation process |
| 2018 | 759 | -0.53% | estimation process |
| 2019 | 753 | -0.8% | estimation process |
| 2020 | 747 | -0.8% | estimation process |
Demographic Facts
| Estimated population as of July 1, 2019 : | 16,516 |
| Based on demographic estimates as of April 1, 2010 : | 15,231 |
| Based on demographic estimates as of 1 April 2010 : | 8.4% |
| April 1, 2020 Population : | 16,071 |
| April 1, 2010 Population : | 15,134 |
| People under 5 years old, percentage : | 7.6% |
| People under 18 years old, percentage : | 27.0% |
| People over 65 (%) : | 16.9% |
| Female persons, % : | 50.8% |
| White only, percent : | 95.0% |
| Black or African American alone, percent : | 0.4% |
| American Indian and Alaska Native only, % : | 0.1% |
| Asians alone % : | 1.5% |
| Only Native Hawaiians and Other Pacific Islanders, % : | 0.0% |
| % of people who have participated in two or more races : | 2.3% |
| % of Hispanic or Latino : | 2.4% |
| White people, not Hispanic or Latino people, make up the majority of the population. : | 93.8% |
| 2015-2019 Veterans : | 1,201 |
| Percentage of foreign-born people, 2015-2019 : | 2.4% |
| Rate of owner-occupied housing units, 2015-2019 : | 79.1% |
Economic Facts
| Rate of owner-occupied housing units, 2015-2019 : | 79.1% |
| Owner-occupied housing unit median value, 2015-2019 : | $180,900 |
| From 2015 to 2019, the median selected monthly owner costs - with a mortgage : | $1,451 |
| Monthly owner costs, without a mortgage, at the median, 2015-2019 : | $603 |
| 2015-2019 median gross rent : | $947 |
| 2015-2019 Households : | 6,589 |
| Population per household, 2015-2019 : | 2.50 |
| Living in the same house a year ago, percentage of people aged one year and up, 2015-2019 : | 87.4% |
| Languages other than English spoken at home, as a percentage of people aged 5 and up, 2015-2019 : | 2.9% |
| Households with computers, %, 2015-2019 : | 90.5% |
| Percentage of households with a broadband Internet subscription, 2015-2019 : | 86.4% |
| Percentage of people aged 25 and up with a high school diploma or higher, 2015-2019 : | 96.7% |
| Bachelor's degree or higher, proportion of people aged 25 and up, 2015-2019 : | 39.9% |
| Percentage of people under the age of 65 who have a disability, 2015-2019 : | 5.1% |
| Persons under the age of 65 who do not have health insurance, as a percentage : | 3.9% |
| Total civilian labor force, percent of population aged 16 and up, 2015-2019 : | 63.8% |
| Female labor force participation in the civilian labor force, as a percentage of the population aged 16 and up, 2015-2019 : | 60.3% |
| Total sales of lodging and food services in 2012 ($1,000) : | 21,876 |
| 2012 total retail sales ($1,000) : | 285,175 |
| 2012 total retail sales per capita : | $18,506 |
| Mean commute time to work (in minutes), workers aged 16 and up, 2015-2019 : | 21.0 |
| 2015-2019 median household income (in 2019 dollars) : | $76,508 |
| Income per capita in the previous 12 months (in 2019 dollars), 2015-2019 : | $35,780 |
| Percentage of people living in poverty : | 3.6% |
| Total number of businesses in 2012 : | 1,031 |
| Men-owned businesses in 2012 : | 396 |
| Women-owned businesses in 2012 : | 446 |
| Minority-owned businesses in 2012 : | 37 |
| Non-minority-owned businesses in 2012 : | 953 |
| Veteran-owned businesses in 2012 : | 60 |
| Nonveteran-owned businesses in 2012 : | 929 |
| 2010 population per square mile : | 1,851.3 |
| 2010 land area in square miles : | 8.17 |
Best Things to Do in New Harmony
1Harmonie State Park
3451 Harmonie State Park Rd, New Harmony, IN 47631, United States View details
Phone: +18126824821 | Website available

2Historic New Harmony Atheneum
401 Arthur St, New Harmony, IN 47631, United States View details
Phone: +18126824474 | Website available

3New Harmony Historic District
506 1/2 Main, New Harmony, IN 47631, United States View details
Phone: +18126823698
Nearby Schools and Colleges
Schools and campuses linked to New Harmony, IN. Select a name to open its map and contact details.
| Code | Name | City | ZIP |
|---|---|---|---|
| 151306 | University of Southern Indiana | Evansville (IN) | 47712 |
Nearby Transit Stations (7)
Rail and bus stations connected to New Harmony, IN. Select a station to open its map and address details.
| Code | Name | Address | Type |
|---|---|---|---|
| EVN | Evansville, IN | 119 Northwest 6th Street | BUS |
| MDV | Madisonville, KY | 4765 Hanson Road | BUS |
| MVI | Mt. Vernon, IL | 102 Potomac Boulevard | BUS |
| MAI | Marion, IL | 2100 West Main Street | BUS |
| CEN | Centralia station | 108 East Broadway | RAIL |
Closest post offices linked to New Harmony.
| Post Office Name | City | ZIP |
|---|---|---|
| New Harmony Post Office | New Harmony (IN) | 47631 |
Other places with the same name (1)
- New Harmony, Utah town in Washington County, Utah, United States with a population of 236 people.
Other cities in Posey County
Cities, towns, neighborhoods & other populated places in Posey County , IN.
| City Name | Population | Title |
|---|---|---|
| Mount Vernon | 6,426 | City in Posey County, Indiana, United States of America |
| Springfield | 3,924 | Human settlement in Indiana, United States of America |
| Oak Grove | 1,565 | Township in Benton County, Indiana |
| Poseyville | 1,031 | Town in Indiana, United States |
| Cynthiana | 532 | Human settlement in Posey County, Indiana, United States of America |
| Prairie | 207 | City in United States of America |
| Griffin | 167 | Town in Indiana, USA |