Lombard, Illinois
Lombard: village in Illinois
About
Lombard is a village located in the county of DuPage in the U.S. state of Illinois. Its population at the 2010 census was 43,165 and a population density of 1,598 people per km². After 10 years in 2020 city had an estimated population of 43,961 inhabitants.
The village was created 157 years ago in 1868.

Quick Facts about Lombard
| Population | 43,961 (2020) |
| Country | United States of America |
| State | Illinois (United States) |
| County | DuPage County |
| Postal code | 60148 |
| Area | 27 km2 |
| Latitude & Longitude | 41.8800,-88.0078 |
| Altitude | 732 feet / 223 meters |
| Establishment | January 01, 1869 (157 years ago) |
| Time Zone | America/Chicago |
| Local time | 11:49:19 (14th July 2026) |
| Density | 1,628 Pop. per km² as of 2020 |
| Population growth | 1.81% (2010-2020) |
| Weather | 95℉ Sunny 7-days weather |
Geography
Lombard is located at 41°52'48"N 88°0'28"W (41.8800300, -88.0078400).
Lombard map
Official website of Lombard
Official WebsiteDemographics
The population of Lombard increased by 1.81% in 10 years.
| Year | Population | % Change | Method |
|---|---|---|---|
| 2010 | 43,165 | - | census |
| 2011 | 43,725 | 1.28% | estimation process |
| 2012 | 43,857 | 0.3% | estimation process |
| 2013 | 43,983 | 0.29% | estimation process |
| 2014 | 43,985 | 0% | estimation process |
| 2015 | 43,879 | -0.24% | estimation process |
| 2016 | 44,035 | 0.35% | estimation process |
| 2017 | 43,872 | -0.37% | estimation process |
| 2018 | 44,612 | 1.66% | estimation process |
| 2019 | 44,303 | -0.7% | estimation process |
| 2020 | 43,961 | -0.78% | estimation process |
Demographic Facts
| Estimated population as of July 1, 2019 : | 59,395 |
| Based on demographic estimates as of April 1, 2010 : | 60,825 |
| Based on demographic estimates as of 1 April 2010 : | -2.4% |
| April 1, 2020 Population : | 60,850 |
| April 1, 2010 Population : | 60,868 |
| People under 5 years old, percentage : | 5.7% |
| People under 18 years old, percentage : | 19.4% |
| People over 65 (%) : | 16.3% |
| Female persons, % : | 53.4% |
| White only, percent : | 78.1% |
| Black or African American alone, percent : | 10.0% |
| American Indian and Alaska Native only, % : | 0.4% |
| Asians alone % : | 1.7% |
| Only Native Hawaiians and Other Pacific Islanders, % : | 0.0% |
| % of people who have participated in two or more races : | 3.8% |
| % of Hispanic or Latino : | 29.2% |
| White people, not Hispanic or Latino people, make up the majority of the population. : | 57.5% |
| 2015-2019 Veterans : | 2,431 |
| Percentage of foreign-born people, 2015-2019 : | 10.2% |
| Rate of owner-occupied housing units, 2015-2019 : | 58.0% |
Economic Facts
| Rate of owner-occupied housing units, 2015-2019 : | 58.0% |
| Owner-occupied housing unit median value, 2015-2019 : | $171,900 |
| From 2015 to 2019, the median selected monthly owner costs - with a mortgage : | $1,559 |
| Monthly owner costs, without a mortgage, at the median, 2015-2019 : | $767 |
| 2015-2019 median gross rent : | $1,027 |
| 2015-2019 Households : | 25,595 |
| Population per household, 2015-2019 : | 2.29 |
| Living in the same house a year ago, percentage of people aged one year and up, 2015-2019 : | 88.2% |
| Languages other than English spoken at home, as a percentage of people aged 5 and up, 2015-2019 : | 26.8% |
| Households with computers, %, 2015-2019 : | 85.0% |
| Percentage of households with a broadband Internet subscription, 2015-2019 : | 77.7% |
| Percentage of people aged 25 and up with a high school diploma or higher, 2015-2019 : | 86.6% |
| Bachelor's degree or higher, proportion of people aged 25 and up, 2015-2019 : | 22.3% |
| Percentage of people under the age of 65 who have a disability, 2015-2019 : | 7.7% |
| Persons under the age of 65 who do not have health insurance, as a percentage : | 5.7% |
| Total civilian labor force, percent of population aged 16 and up, 2015-2019 : | 64.9% |
| Female labor force participation in the civilian labor force, as a percentage of the population aged 16 and up, 2015-2019 : | 60.6% |
| Total sales of lodging and food services in 2012 ($1,000) : | 67,782 |
| Total receipts/revenue for health care and social assistance in 2012 ($1,000) : | 490,815 |
| Manufacturers' total shipments in 2012 ($1,000) : | 940,158 |
| 2012 total retail sales ($1,000) : | 750,722 |
| 2012 total retail sales per capita : | $12,380 |
| Mean commute time to work (in minutes), workers aged 16 and up, 2015-2019 : | 23.0 |
| 2015-2019 median household income (in 2019 dollars) : | $58,843 |
| Income per capita in the previous 12 months (in 2019 dollars), 2015-2019 : | $33,687 |
| Percentage of people living in poverty : | 10.4% |
| Total number of businesses in 2012 : | 3,716 |
| Men-owned businesses in 2012 : | 2,275 |
| Women-owned businesses in 2012 : | 999 |
| Minority-owned businesses in 2012 : | 781 |
| Non-minority-owned businesses in 2012 : | 2,720 |
| Veteran-owned businesses in 2012 : | 512 |
| Nonveteran-owned businesses in 2012 : | 2,967 |
| 2010 population per square mile : | 2,558.2 |
| 2010 land area in square miles : | 23.79 |
Best Things to Do in Lombard
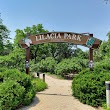
1Lilacia Park
150 S Park Ave, Lombard, IL 60148, United States View details
Phone: +16306207322 | Website available
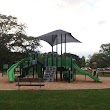
2Lombard Park District - Madison Meadow
E Madison St & S Ahrens Ave, Lombard, IL 60148, United States View details
Phone: +16306207322 | Website available

3Paradise Bay Water Park
437 E St Charles Rd, Lombard, IL 60148, United States View details
Phone: +16306276127 | Website available

4East Branch Forest Preserve
1901 Glen Ellyn Rd, Lombard, IL 60148, United States View details
Phone: +16309337200 | Website available

5Lombard Common
433 E St Charles Rd, Lombard, IL 60148, United States View details
Phone: +16306207322 | Website available
Where to Eat in Lombard
1Enchanted Castle Restaurant & Entertainment Complex
1103 S Main St, Lombard, IL 60148, United States View details
Phone: +16309537860 | Website available

Where to Stay in Lombard
1Hyatt Place Chicago/Lombard/Oak Brook
2340 Fountain Square Dr, Lombard, IL 60148, United States View details
Phone: +16309326501 | Website available

Nearby Schools and Colleges
Schools and campuses linked to Lombard, IL. Select a name to open its map and contact details.
| Code | Name | City | ZIP |
|---|---|---|---|
| 147590 | National University of Health Sciences | Lombard (IL) | 60148-4583 |
Nearby Transit Stations (21)
Rail and bus stations connected to Lombard, IL. Select a station to open its map and address details.
| Code | Name | Address | Type |
|---|---|---|---|
| LAG | La Grange Road | 25 West Burlington St. | RAIL |
| NPV | Naperville | 105 E. Fourth Ave. | RAIL |
| SMT | Summit | Archer Ave. and South Center Ave. | RAIL |
| GLN | Glenview station | 1116 Depot St. | RAIL |
| CHI | Chicago Union Station | 225 South Canal Street | RAIL |
Closest post offices linked to Lombard.
| Post Office Name | City | ZIP |
|---|---|---|
| Lombard Post Office | Lombard (IL) | 60148 |
Other cities in DuPage County
Cities, towns, neighborhoods & other populated places in DuPage County , IL. (more)
| City Name | Population | Title |
|---|---|---|
| Naperville | 147,986 | The second most populous city in Illinois. |
| Wheaton | 52,451 | The most populous city in DuPage County, Illinois. |
| Downers Grove | 48,727 | Village in Downers Grove, Lisle, and York Townships, DuPage County, Illinois, US |
| Elmhurst | 46,532 | A city in DuPage County, Illinois. |
| Carol Stream | 38,821 | Town |
| Glendale Heights | 33,351 | Town |
| Woodridge | 33,329 | Suburb of Chicago in Illinois, USA |
| Glen Ellyn | 27,402 | Town in DuPage County, Illinois, USA |
| West Chicago | 26,593 | City in DuPage County, Illinois, United States |
| Westmont | 24,266 | City in DuPage County, Illinois, United States of America |
| Lisle | 23,153 | Town in Illinois |
| Roselle | 22,550 | Village in Ilinois, United States of America |
| Bloomingdale | 21,723 | Township in DuPage County, Illinois |
| Darien | 21,531 | Town in Connecticut |
| Villa Park | 21,291 | Human settlement in DuPage County, Illinois, United States of America |
| Bensenville | 17,943 | Village in United States of America |
Distance to Other Cities
Lombard distances to largest Illinois cities