Lisle, Illinois
Lisle: town in Illinois
About
Lisle is a town located in the county of DuPage in the U.S. state of Illinois. Its population at the 2010 census was 22,390 and a population density of 1,202 people per km². After 10 years in 2020 city had an estimated population of 23,153 inhabitants.
The town was created 194 years ago in 1831.

Quick Facts about Lisle
| Population | 23,153 (2020) |
| Country | United States of America |
| State | Illinois (United States) |
| County | DuPage County |
| Postal code | 60532 |
| Area | 18.63 km2 |
| Latitude & Longitude | 41.8011,-88.0748 |
| Altitude | 679 feet / 207 meters |
| Establishment | January 01, 1832 (194 years ago) |
| Time Zone | America/Chicago |
| Local time | 10:53:26 (3rd August 2026) |
| Density | 1,243 Pop. per km² as of 2020 |
| Population growth | 3.3% (2010-2020) |
| Weather | 81℉ Patchy Fog then Mostly Sunny 7-days weather |

Geography
Lisle is located at 41°48'4"N 88°4'29"W (41.8011400, -88.0747900).
Lisle map
Weather
Patchy fog before 8am. Mostly sunny, with a high near 81. East northeast wind around 5 mph.
7-Day ForecastOfficial website of Lisle
Official WebsiteDemographics
The population of Lisle increased by 3.3% in 10 years.
| Year | Population | % Change | Method |
|---|---|---|---|
| 2010 | 22,390 | - | census |
| 2011 | 23,567 | 4.99% | estimation process |
| 2012 | 23,670 | 0.44% | estimation process |
| 2013 | 23,438 | -0.99% | estimation process |
| 2014 | 23,518 | 0.34% | estimation process |
| 2015 | 23,654 | 0.57% | estimation process |
| 2016 | 23,624 | -0.13% | estimation process |
| 2017 | 23,557 | -0.28% | estimation process |
| 2018 | 23,464 | -0.4% | estimation process |
| 2019 | 23,309 | -0.66% | estimation process |
| 2020 | 23,153 | -0.67% | estimation process |
Demographic Facts
| Estimated population as of July 1, 2019 : | 12,339 |
| Based on demographic estimates as of April 1, 2010 : | 12,876 |
| Based on demographic estimates as of 1 April 2010 : | -4.2% |
| April 1, 2020 Population : | 12,325 |
| April 1, 2010 Population : | 12,902 |
| People under 5 years old, percentage : | 5.3% |
| People under 18 years old, percentage : | 19.5% |
| People over 65 (%) : | 17.0% |
| Female persons, % : | 53.8% |
| White only, percent : | 78.5% |
| Black or African American alone, percent : | 8.9% |
| American Indian and Alaska Native only, % : | 0.2% |
| Asians alone % : | 4.0% |
| Only Native Hawaiians and Other Pacific Islanders, % : | 0.0% |
| % of people who have participated in two or more races : | 3.8% |
| % of Hispanic or Latino : | 22.0% |
| White people, not Hispanic or Latino people, make up the majority of the population. : | 63.9% |
| 2015-2019 Veterans : | 578 |
| Percentage of foreign-born people, 2015-2019 : | 16.4% |
| Rate of owner-occupied housing units, 2015-2019 : | 57.3% |
Economic Facts
| Rate of owner-occupied housing units, 2015-2019 : | 57.3% |
| Owner-occupied housing unit median value, 2015-2019 : | $206,300 |
| From 2015 to 2019, the median selected monthly owner costs - with a mortgage : | $1,922 |
| Monthly owner costs, without a mortgage, at the median, 2015-2019 : | $815 |
| 2015-2019 median gross rent : | $1,087 |
| 2015-2019 Households : | 5,146 |
| Population per household, 2015-2019 : | 2.38 |
| Living in the same house a year ago, percentage of people aged one year and up, 2015-2019 : | 90.7% |
| Languages other than English spoken at home, as a percentage of people aged 5 and up, 2015-2019 : | 25.7% |
| Households with computers, %, 2015-2019 : | 81.5% |
| Percentage of households with a broadband Internet subscription, 2015-2019 : | 75.2% |
| Percentage of people aged 25 and up with a high school diploma or higher, 2015-2019 : | 86.2% |
| Bachelor's degree or higher, proportion of people aged 25 and up, 2015-2019 : | 20.2% |
| Percentage of people under the age of 65 who have a disability, 2015-2019 : | 10.9% |
| Persons under the age of 65 who do not have health insurance, as a percentage : | 7.3% |
| Total civilian labor force, percent of population aged 16 and up, 2015-2019 : | 67.7% |
| Female labor force participation in the civilian labor force, as a percentage of the population aged 16 and up, 2015-2019 : | 61.6% |
| Total sales of lodging and food services in 2012 ($1,000) : | 30,044 |
| Total receipts/revenue for health care and social assistance in 2012 ($1,000) : | 192,226 |
| 2012 total retail sales ($1,000) : | 365,459 |
| 2012 total retail sales per capita : | $28,485 |
| Mean commute time to work (in minutes), workers aged 16 and up, 2015-2019 : | 27.4 |
| 2015-2019 median household income (in 2019 dollars) : | $56,357 |
| Income per capita in the previous 12 months (in 2019 dollars), 2015-2019 : | $31,936 |
| Percentage of people living in poverty : | 13.0% |
| Total number of businesses in 2012 : | 1,160 |
| Men-owned businesses in 2012 : | 614 |
| Women-owned businesses in 2012 : | 428 |
| Minority-owned businesses in 2012 : | 160 |
| Non-minority-owned businesses in 2012 : | 946 |
| Veteran-owned businesses in 2012 : | 134 |
| Nonveteran-owned businesses in 2012 : | 942 |
| 2010 population per square mile : | 2,552.1 |
| 2010 land area in square miles : | 5.06 |
Best Things to Do in Lisle
1The Morton Arboretum
4100 IL-53, Lisle, IL 60532, United States View details
Phone: +16309680074 | Website available

2Lisle Community Park C4 Field
1825 Short St, Lisle, IL 60532, United States View details
Phone: +16309643410

3Sensory Garden Playground
2751 Navistar Dr, Lisle, IL 60532, United States View details
Phone: +16306904880 | Website available

4Sea Lion Aquatic Park
1825 Short St, Lisle, IL 60532, United States View details
Phone: +16309643410 | Website available

5Egermann Woods County Forest Preserve
Hobson Rd, Lisle, IL 60532, United States View details
Phone: +16309337200 | Website available
Where to Stay in Lisle
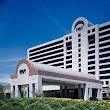
1Hyatt Regency Lisle Near Naperville
1400 Corporetum Dr, Lisle, IL 60532, United States View details
Phone: +16308521234 | Website available
People born in Lisle (2)
People born in Lisle, including soccer player Brian Plotkin, basketball player Frank Kaminsky, .
More notable people
Nearby Schools and Colleges
Schools and campuses linked to Lisle, IL. Select a name to open its map and contact details.
| Code | Name | City | ZIP |
|---|---|---|---|
| 147697 | Northern Baptist Theological Seminary | Lisle (IL) | 60532-1348 |
Nearby Transit Stations (22)
Rail and bus stations connected to Lisle, IL. Select a station to open its map and address details.
| Code | Name | Address | Type |
|---|---|---|---|
| NPV | Naperville | 105 E. Fourth Ave. | RAIL |
| LAG | La Grange Road | 25 West Burlington St. | RAIL |
| SMT | Summit | Archer Ave. and South Center Ave. | RAIL |
| JOL | Joliet Transportation Center | 50 East Jefferson Street | RAIL |
| CHI | Chicago Union Station | 225 South Canal Street | RAIL |
Closest post offices linked to Lisle.
| Post Office Name | City | ZIP |
|---|---|---|
| Lisl Post Office | Lisle (IL) | 60532 |
Other places with the same name (1)
- Lisle, New York city in Broome County, New York, United States of America with a population of 294 people.
Other cities in DuPage County
Cities, towns, neighborhoods & other populated places in DuPage County , IL. (more)
| City Name | Population | Title |
|---|---|---|
| Naperville | 147,986 | The second most populous city in Illinois. |
| Wheaton | 52,451 | The most populous city in DuPage County, Illinois. |
| Downers Grove | 48,727 | Village in Downers Grove, Lisle, and York Townships, DuPage County, Illinois, US |
| Elmhurst | 46,532 | A city in DuPage County, Illinois. |
| Lombard | 43,961 | Village in Illinois |
| Carol Stream | 38,821 | Town |
| Glendale Heights | 33,351 | Town |
| Woodridge | 33,329 | Suburb of Chicago in Illinois, USA |
| Glen Ellyn | 27,402 | Town in DuPage County, Illinois, USA |
| West Chicago | 26,593 | City in DuPage County, Illinois, United States |
| Westmont | 24,266 | City in DuPage County, Illinois, United States of America |
| Roselle | 22,550 | Village in Ilinois, United States of America |
| Bloomingdale | 21,723 | Township in DuPage County, Illinois |
| Darien | 21,531 | Town in Connecticut |
| Villa Park | 21,291 | Human settlement in DuPage County, Illinois, United States of America |
| Bensenville | 17,943 | Village in United States of America |
Distance to Other Cities
Lisle distances to largest Illinois cities