Kiribati (Republic of Kiribati), KI
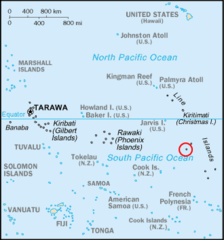
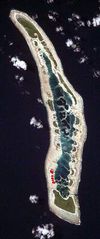
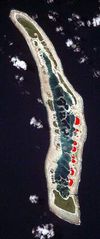
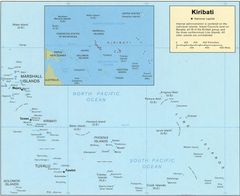
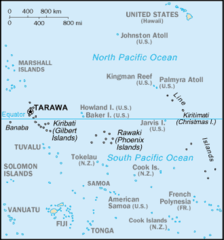
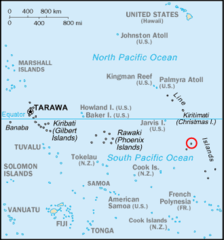
Kiribati: Located in the central Pacific Ocean, this island nation comprises 32 atolls and one raised coral island, Banaba, scattered over a vast area.
About

Country Snapshot
Republic of Kiribati at a glance
Republic of Kiribati currently has 7 quality-checked populated place pages and 2 state or regional pages linked on MapSof.
Mapped cities & towns
7
These counts use a stricter populated-place filter so the main lists stay focused on real city and town pages.
States & regions
2
Open related pagesLargest city
TarawaPopulation 40,311
Top linked places
Quick Facts about Republic of Kiribati
| Population | 120,740 |
| Country | Kiribati |
| Area | 811 km2 |
| Official name | la République des Kiribati, Republic of Kiribati, Kiribati |
| Continent | Oceania |
| Easternmost point | Point(-150.2115 -9.936980555) |
| Northernmost point | Point(-160.4 4.72) |
| Latitude & Longitude | 1.4210,172.9840 |
| Legislative body | House of Assembly of Kiribati |
| Named for | Thomas Gilbert |
| Official language | Gilbertese, English |
| Capital | South Tarawa |
| Establishment | July 12, 1979 (46 years ago) |
| Time Zone | UTC+13:00, UTC+12:00, UTC+14:00 |
| Local time | 05:59:42 (20th June 2026) |
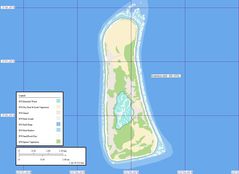
Geography
Republic of Kiribati is located at 1°25'16"N 172°59'2"E (1.4210000, 172.9840000).
Kiribati map
The largest city of Republic of Kiribati is Tarawa with a population of 40,311. . See all Republic of Kiribati cities & populated places.
Official website of Republic of Kiribati
Official WebsiteDemographics
| Year | Population | % Change | Method |
|---|---|---|---|
| 1931 | 29,751 | - | census |
| 1947 | 31,513 | 5.59% | census |
| 1960 | 32,970 | 4.42% | census |
| 1961 | 33,873 | 2.67% | census |
| 1962 | 34,800 | 2.66% | census |
| 1963 | 43,336 | 19.7% | census |
| 1964 | 36,789 | -17.8% | census |
| 1965 | 37,881 | 2.88% | census |
| 1966 | 39,055 | 3.01% | census |
| 1967 | 40,296 | 3.08% | census |
| 1968 | 47,735 | 15.58% | census |
| 1969 | 42,756 | -11.65% | estimation process |
| 1970 | 43,860 | 2.52% | census |
| 1971 | 44,843 | 2.19% | census |
| 1972 | 45,731 | 1.94% | census |
| 1973 | 51,926 | 11.93% | census |
| 1974 | 47,446 | -9.44% | estimation process |
| 1975 | 48,404 | 1.98% | estimation process |
| 1976 | 49,466 | 2.15% | census |
| 1977 | 50,617 | 2.27% | census |
| 1978 | 56,213 | 9.95% | census |
| 1979 | 53,154 | -5.75% | census |
| 1980 | 54,510 | 2.49% | census |
| 1981 | 55,908 | 2.5% | census |
| 1982 | 57,352 | 2.52% | estimation process |
| 1983 | 58,860 | 2.56% | census |
| 1984 | 60,455 | 2.64% | census |
| 1985 | 63,883 | 5.37% | census |
| 1986 | 63,950 | 0.1% | census |
| 1987 | 65,841 | 2.87% | census |
| 1988 | 67,729 | 2.79% | census |
| 1989 | 69,490 | 2.53% | census |
| 1990 | 72,335 | 3.93% | census |
| 1991 | 72,343 | 0.01% | census |
| 1992 | 73,434 | 1.49% | census |
| 1993 | 74,395 | 1.29% | census |
| 1994 | 75,346 | 1.26% | census |
| 1995 | 77,658 | 2.98% | census |
| 1996 | 77,511 | -0.19% | census |
| 1997 | 78,725 | 1.54% | census |
| 1998 | 80,018 | 1.62% | census |
| 1999 | 81,377 | 1.67% | census |
| 2000 | 84,494 | 3.69% | census |
| 2001 | 84,261 | -0.28% | census |
| 2002 | 85,799 | 1.79% | census |
| 2003 | 87,371 | 1.8% | census |
| 2004 | 88,936 | 1.76% | census |
| 2005 | 92,533 | 3.89% | census |
| 2006 | 91,953 | -0.63% | census |
| 2007 | 93,401 | 1.55% | census |
| 2008 | 94,832 | 1.51% | census |
| 2009 | 96,272 | 1.5% | census |
| 2010 | 103,058 | 6.58% | census |
| 2011 | 99,250 | -3.84% | census |
| 2012 | 100,786 | 1.52% | census |
| 2013 | 102,351 | 1.53% | census |
| 2014 | 109,391 | 6.44% | (Worldbank) |
| 2015 | 110,136 | 0.68% | census |
| 2016 | 112,524 | 2.12% | (Worldbank) |
| 2017 | 116,398 | 3.33% | estimation process |
| 2018 | 115,847 | -0.48% | (Worldbank) |
| 2019 | 117,606 | 1.5% | (Worldbank) |
| 2026 | 120,740 | 2.6% |
Map & Images (more maps)
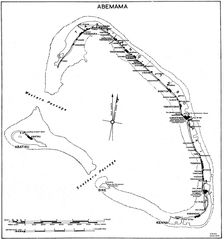
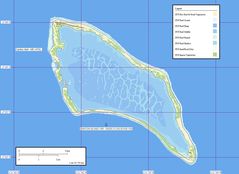
Abemama Map
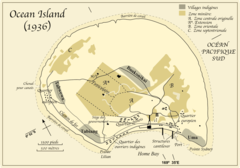
Banaba Island Fr
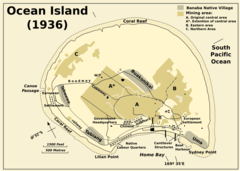
Banaba Island
Birnie
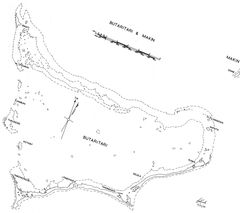
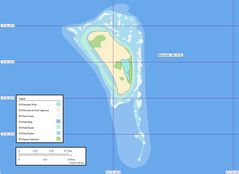
Butaritari Map
Canton Atoll Map
Carolineisland Centralleeward
Carolineisland Long
Carolineisland Nake
Carolineisland South Nake
Carolineisland South
Carolineisland Southleeward
Carolineisland Windward Islets
Enderbury Map
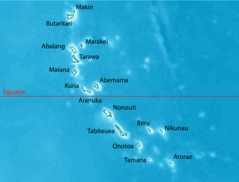
Gilbertislandspos
Kiribati Map Loc
Kiribati Cia Wfb Map
Kiribati Caroline Highlighted
Kiribati Flint Highlighted
Kiribati Malden Highlighted