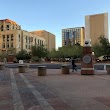
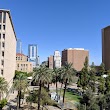
Phoenix, Arizona
Phoenix: The fifth most populous city in the United States and the center of the Phoenix metropolitan area.
About
Phoenix is a city located in the county of Maricopa in the U.S. state of Arizona. Its population at the 2010 census was 1,445,632. After 10 years in 2020 city had an estimated population of 1,708,127 inhabitants.
The city was created 158 years ago in 1867.
Phoenix is the capital and most populous city in Arizona. As of July 29, 2023, it has an estimated population of 1.7 million, making it the 5th largest city in the United States. Here are some key facts about Phoenix:
History
Phoenix was incorporated as a city in 1881. It was named for the mythical phoenix bird as it rose from the ruins of an ancient civilization. Phoenix grew rapidly after WWII and the invention of air conditioning.
Location & Geography
Phoenix is located in the Sonoran Desert in central Arizona. The city lies along the Salt River and has many peaks and mountains scattered around it.
Economy
Major industries in Phoenix include tourism, healthcare, transportation, high tech, and retail. Large companies headquartered there include PetSmart and Discount Tire.
Population & Culture
Phoenix has a large Hispanic/Latino population accounting for over 40% of its residents. It has a thriving arts scene including performances, festivals, and over 50 museums.
Climate & Lifestyle
Phoenix has a hot desert climate with extremely warm summers. It averages over 300 days of sunshine annually. Popular activities include golfing, hiking, and enjoying the outdoors.
In summary, Phoenix is a massive desert metropolis known for its sunny weather, Southwest culture, economic growth and diversity. It continues to expand and attract new residents.

Quick Facts about Phoenix
| Population | 1,708,127 (2020) |
| Country | United States of America |
| State | Arizona (United States) |
| County | Maricopa County |
| Different from | Philadelphia |
| Postal code | 85003 |
| Phone Area Codes | 623, 602, 520, 480 |
| Latitude & Longitude | 33.4484,-112.0740 |
| Legislative body | Phoenix City Council |
| Named for | phoenix |
| Altitude | 1,086 feet / 331 meters |
| Capital city | Phoenix is capital of Arizona, Maricopa County |
| Establishment | January 01, 1868 (158 years ago) |
| Time Zone | Mountain Time Zone, UTC−07:00 |
| Local time | 05:24:30 (24th July 2026) |
| Population growth | 15.37% (2010-2020) |
| Weather | 93℉ Mostly Clear 7-days weather |

Geography
Phoenix is located at 33°26'54"N 112°4'27"W (33.4483800, -112.0740400).
Phoenix map
Weather
Mostly clear, with a low around 93. Heat index values as high as 111. West southwest wind around 0 mph.
7-Day ForecastOfficial website of Phoenix
Official Website- Calgary
- Catania
- Chengdu (1987 )
- Dubai
- Ennis
- Grenoble
- Hermosillo
- Himeji
- Prague
- Ramat Gan
- Suceava
- Taipei (1979 )
Demographics
The population of Phoenix increased by 15.37% in 10 years.
| Year | Population | % Change | Method |
|---|---|---|---|
| 2010 | 1,445,632 | - | census |
| 2011 | 1,469,796 | 1.64% | estimation process |
| 2012 | 1,499,274 | 1.97% | estimation process |
| 2013 | 1,526,491 | 1.78% | estimation process |
| 2014 | 1,555,445 | 1.86% | estimation process |
| 2015 | 1,583,690 | 1.78% | estimation process |
| 2016 | 1,612,199 | 1.77% | estimation process |
| 2017 | 1,633,560 | 1.31% | estimation process |
| 2018 | 1,654,675 | 1.28% | estimation process |
| 2019 | 1,680,992 | 1.57% | estimation process |
| 2020 | 1,708,127 | 1.59% | estimation process |
Demographic Facts
| Estimated population as of July 1, 2019 : | 15,813 |
| Based on demographic estimates as of April 1, 2010 : | 15,299 |
| Based on demographic estimates as of 1 April 2010 : | 3.4% |
| April 1, 2020 Population : | 16,351 |
| April 1, 2010 Population : | 15,301 |
| People under 5 years old, percentage : | 2.9% |
| People under 18 years old, percentage : | 13.3% |
| People over 65 (%) : | 37.1% |
| Female persons, % : | 53.1% |
| White only, percent : | 89.7% |
| Black or African American alone, percent : | 0.8% |
| American Indian and Alaska Native only, % : | 3.6% |
| Asians alone % : | 1.6% |
| Only Native Hawaiians and Other Pacific Islanders, % : | 0.0% |
| % of people who have participated in two or more races : | 1.6% |
| % of Hispanic or Latino : | 7.5% |
| White people, not Hispanic or Latino people, make up the majority of the population. : | 85.1% |
| 2015-2019 Veterans : | 1,681 |
| Percentage of foreign-born people, 2015-2019 : | 5.0% |
| Rate of owner-occupied housing units, 2015-2019 : | 78.8% |
Economic Facts
| Rate of owner-occupied housing units, 2015-2019 : | 78.8% |
| Owner-occupied housing unit median value, 2015-2019 : | $236,300 |
| From 2015 to 2019, the median selected monthly owner costs - with a mortgage : | $1,404 |
| Monthly owner costs, without a mortgage, at the median, 2015-2019 : | $466 |
| 2015-2019 median gross rent : | $966 |
| 2015-2019 Households : | 7,002 |
| Population per household, 2015-2019 : | 2.17 |
| Living in the same house a year ago, percentage of people aged one year and up, 2015-2019 : | 83.0% |
| Languages other than English spoken at home, as a percentage of people aged 5 and up, 2015-2019 : | 10.4% |
| Households with computers, %, 2015-2019 : | 91.3% |
| Percentage of households with a broadband Internet subscription, 2015-2019 : | 84.4% |
| Percentage of people aged 25 and up with a high school diploma or higher, 2015-2019 : | 92.6% |
| Bachelor's degree or higher, proportion of people aged 25 and up, 2015-2019 : | 25.6% |
| Percentage of people under the age of 65 who have a disability, 2015-2019 : | 13.6% |
| Persons under the age of 65 who do not have health insurance, as a percentage : | 17.7% |
| Total civilian labor force, percent of population aged 16 and up, 2015-2019 : | 44.3% |
| Female labor force participation in the civilian labor force, as a percentage of the population aged 16 and up, 2015-2019 : | 40.4% |
| Manufacturers' total shipments in 2012 ($1,000) : | 12,693 |
| 2012 total retail sales ($1,000) : | 242,322 |
| 2012 total retail sales per capita : | $15,927 |
| Mean commute time to work (in minutes), workers aged 16 and up, 2015-2019 : | 18.8 |
| 2015-2019 median household income (in 2019 dollars) : | $51,280 |
| Income per capita in the previous 12 months (in 2019 dollars), 2015-2019 : | $31,109 |
| Percentage of people living in poverty : | 10.8% |
| Total number of businesses in 2012 : | 1,636 |
| Men-owned businesses in 2012 : | 763 |
| Women-owned businesses in 2012 : | 500 |
| Minority-owned businesses in 2012 : | 252 |
| Non-minority-owned businesses in 2012 : | 1,246 |
| Veteran-owned businesses in 2012 : | 241 |
| Nonveteran-owned businesses in 2012 : | 1,236 |
| 2010 population per square mile : | 786.0 |
| 2010 land area in square miles : | 19.47 |
| Rate of owner-occupied housing units, 2015-2019 : | 93.1% |
| Owner-occupied housing unit median value, 2015-2019 : | $1,516,200 |
| From 2015 to 2019, the median selected monthly owner costs - with a mortgage : | $4,000+ |
| Monthly owner costs, without a mortgage, at the median, 2015-2019 : | $1,482 |
| 2015-2019 median gross rent : | $2,547 |
| 2015-2019 Households : | 5,352 |
| Population per household, 2015-2019 : | 2.67 |
| Living in the same house a year ago, percentage of people aged one year and up, 2015-2019 : | 92.2% |
| Languages other than English spoken at home, as a percentage of people aged 5 and up, 2015-2019 : | 8.2% |
| Households with computers, %, 2015-2019 : | 98.4% |
| Percentage of households with a broadband Internet subscription, 2015-2019 : | 95.6% |
| Percentage of people aged 25 and up with a high school diploma or higher, 2015-2019 : | 97.7% |
| Bachelor's degree or higher, proportion of people aged 25 and up, 2015-2019 : | 70.9% |
| Percentage of people under the age of 65 who have a disability, 2015-2019 : | 4.5% |
| Persons under the age of 65 who do not have health insurance, as a percentage : | 5.0% |
| Total civilian labor force, percent of population aged 16 and up, 2015-2019 : | 55.3% |
| Female labor force participation in the civilian labor force, as a percentage of the population aged 16 and up, 2015-2019 : | 44.4% |
| Total receipts/revenue for health care and social assistance in 2012 ($1,000) : | 125,009 |
| 2012 total retail sales ($1,000) : | 14,773 |
| 2012 total retail sales per capita : | $1,123 |
| Mean commute time to work (in minutes), workers aged 16 and up, 2015-2019 : | 23.7 |
| 2015-2019 median household income (in 2019 dollars) : | $211,393 |
| Income per capita in the previous 12 months (in 2019 dollars), 2015-2019 : | $132,106 |
| Percentage of people living in poverty : | 3.6% |
| Total number of businesses in 2012 : | 2,180 |
| Men-owned businesses in 2012 : | 1,277 |
| Women-owned businesses in 2012 : | 455 |
| Minority-owned businesses in 2012 : | 152 |
| Non-minority-owned businesses in 2012 : | 1,858 |
| Veteran-owned businesses in 2012 : | 293 |
| Nonveteran-owned businesses in 2012 : | 1,770 |
| 2010 population per square mile : | 830.9 |
| 2010 land area in square miles : | 15.43 |
| Rate of owner-occupied housing units, 2015-2019 : | 40.5% |
| Owner-occupied housing unit median value, 2015-2019 : | $338,400 |
| From 2015 to 2019, the median selected monthly owner costs - with a mortgage : | $2,362 |
| Monthly owner costs, without a mortgage, at the median, 2015-2019 : | $984 |
| 2015-2019 median gross rent : | $1,326 |
| 2015-2019 Households : | 11,547 |
| Population per household, 2015-2019 : | 2.74 |
| Living in the same house a year ago, percentage of people aged one year and up, 2015-2019 : | 92.6% |
| Languages other than English spoken at home, as a percentage of people aged 5 and up, 2015-2019 : | 62.2% |
| Households with computers, %, 2015-2019 : | 90.5% |
| Percentage of households with a broadband Internet subscription, 2015-2019 : | 83.3% |
| Percentage of people aged 25 and up with a high school diploma or higher, 2015-2019 : | 85.7% |
| Bachelor's degree or higher, proportion of people aged 25 and up, 2015-2019 : | 20.1% |
| Percentage of people under the age of 65 who have a disability, 2015-2019 : | 6.8% |
| Persons under the age of 65 who do not have health insurance, as a percentage : | 17.0% |
| Total civilian labor force, percent of population aged 16 and up, 2015-2019 : | 65.1% |
| Female labor force participation in the civilian labor force, as a percentage of the population aged 16 and up, 2015-2019 : | 58.7% |
| Total sales of lodging and food services in 2012 ($1,000) : | 28,926 |
| Total receipts/revenue for health care and social assistance in 2012 ($1,000) : | 20,267 |
| Manufacturers' total shipments in 2012 ($1,000) : | 145,957 |
| 2012 total retail sales ($1,000) : | 213,119 |
| 2012 total retail sales per capita : | $6,903 |
| Mean commute time to work (in minutes), workers aged 16 and up, 2015-2019 : | 27.5 |
| 2015-2019 median household income (in 2019 dollars) : | $62,939 |
| Income per capita in the previous 12 months (in 2019 dollars), 2015-2019 : | $30,376 |
| Percentage of people living in poverty : | 16.0% |
| Total number of businesses in 2012 : | 2,755 |
| Men-owned businesses in 2012 : | 1,615 |
| Women-owned businesses in 2012 : | 911 |
| Minority-owned businesses in 2012 : | 758 |
| Non-minority-owned businesses in 2012 : | 1,945 |
| Veteran-owned businesses in 2012 : | 200 |
| Nonveteran-owned businesses in 2012 : | 2,488 |
| 2010 population per square mile : | 14,524.8 |
| 2010 land area in square miles : | 2.10 |
| Rate of owner-occupied housing units, 2015-2019 : | 51.5% |
| Owner-occupied housing unit median value, 2015-2019 : | $123,300 |
| From 2015 to 2019, the median selected monthly owner costs - with a mortgage : | $1,093 |
| Monthly owner costs, without a mortgage, at the median, 2015-2019 : | $441 |
| 2015-2019 median gross rent : | $669 |
| 2015-2019 Households : | 3,275 |
| Population per household, 2015-2019 : | 2.03 |
| Living in the same house a year ago, percentage of people aged one year and up, 2015-2019 : | 73.1% |
| Languages other than English spoken at home, as a percentage of people aged 5 and up, 2015-2019 : | 3.8% |
| Households with computers, %, 2015-2019 : | 92.6% |
| Percentage of households with a broadband Internet subscription, 2015-2019 : | 81.6% |
| Percentage of people aged 25 and up with a high school diploma or higher, 2015-2019 : | 87.9% |
| Bachelor's degree or higher, proportion of people aged 25 and up, 2015-2019 : | 19.6% |
| Percentage of people under the age of 65 who have a disability, 2015-2019 : | 8.7% |
| Persons under the age of 65 who do not have health insurance, as a percentage : | 4.6% |
| Total civilian labor force, percent of population aged 16 and up, 2015-2019 : | 65.2% |
| Female labor force participation in the civilian labor force, as a percentage of the population aged 16 and up, 2015-2019 : | 62.0% |
| Total receipts/revenue for health care and social assistance in 2012 ($1,000) : | 33,866 |
| Manufacturers' total shipments in 2012 ($1,000) : | 185,373 |
| 2012 total retail sales ($1,000) : | 151,735 |
| 2012 total retail sales per capita : | $19,453 |
| Mean commute time to work (in minutes), workers aged 16 and up, 2015-2019 : | 12.7 |
| 2015-2019 median household income (in 2019 dollars) : | $45,150 |
| Income per capita in the previous 12 months (in 2019 dollars), 2015-2019 : | $25,535 |
| Percentage of people living in poverty : | 16.0% |
| Total number of businesses in 2012 : | 752 |
| Men-owned businesses in 2012 : | 312 |
| Women-owned businesses in 2012 : | 293 |
| Minority-owned businesses in 2012 : | F |
| Non-minority-owned businesses in 2012 : | 683 |
| Veteran-owned businesses in 2012 : | 74 |
| Nonveteran-owned businesses in 2012 : | 624 |
| 2010 population per square mile : | 1,467.4 |
| 2010 land area in square miles : | 5.29 |
Best Things to Do in Phoenix
1The Phoenix Police Museum
Historic City Hall, 17 S 2nd Ave, Phoenix, AZ 85003, United States View details
Phone: +16025347278 | Website available

Where to Eat in Phoenix
1City Hall Grill
200 W Washington St, Phoenix, AZ 85003, United States View details
Phone: +16024953687

Where to Stay in Phoenix
1Hampton Inn Phoenix-Midtown-Downtown Area
160 W Catalina Dr, Phoenix, AZ 85013, United States View details
Phone: +16022000990 | Website available
Services and Civic Places in Phoenix
1Phoenix City Hall
200 W Washington St, Phoenix, AZ 85003, United States View details
Phone: +16022626011 | Website available
2Arizona Department of Agriculture
1688 W Adams St, Phoenix, AZ 85007, United States View details
Phone: +16025424373 | Website available
3Phoenix City Manager
200 W Washington St, Phoenix, AZ 85003, United States View details
Phone: +16022626941 | Website available
4Phoenix City Council Chambers
200 W Jefferson St, Phoenix, AZ 85007, United States View details
Website available
5Arizona Department of Agriculture, Weights and Measures Services Division
1688 W Adams St, Phoenix, AZ 85007, United States View details
Phone: +16027714920 | Website available
6Phoenix City Hall
4019 W Glenrosa Ave, Phoenix, AZ 85019, United States View details
Website available
7Phoenix Tax & License Division
251 W Washington St # 3, Phoenix, AZ 85003, United States View details
Phone: +16022626785 | Website available

8Phoenix City Clerk Department
200 W Washington St, Phoenix, AZ 85003, United States View details
Phone: +16022626811 | Website available

9City of Phoenix
138 E Union Hills Dr, Phoenix, AZ 85024, United States View details
Website available
10Phoenix City Office
140 N 3rd Ave, Phoenix, AZ 85003, United States View details
Phone: +16022618542 | Website available

People born in Phoenix (200)
People born in Phoenix, including German-host Steven Gätjen, model and actress Amber Valletta, singer Melody Thornton, .
More notable people
- Georganne Moline (Athletics competitor, hurdler) she was born in 06/03/1990
- George Follmer (racecar driver) he was born in 27/01/1934
- Bobby Ball (American racecar driver) he was born in 26/08/1925
- Jimmy Bryan (American racecar driver) he was born in 28/01/1926
- Eddie Cheever (American racing driver) he was born in 10/01/1958
- Wayne Weiler (American racing driver) he was born in 09/12/1934
- Chad Mirkin (American chemist) he was born in 23/11/1963
- Chelsea Kane (American actress and singer) she was born in 15/09/1988
- Jordin Sparks (American singer, songwriter and actress) she was born in 22/12/1989
- Ashley Roberts (American dancer, actor and musician) she was born in 14/09/1981
- Michelle Branch (American singer-songwriter and guitarist) she was born in 02/07/1983
- Stevie Nicks (American singer and songwriter, member of Fleetwood Mac) she was born in 26/05/1948
- Mare Winningham (American actress and singer-songwriter) she was born in 16/05/1959
- Cindy McCain (American philanthropist) she was born in 20/05/1954
- Amy Davidson (American actress) she was born in 15/09/1979
- Lynda Carter (American actress, singer, songwriter and beauty pageant titleholder) she was born in 24/07/1951
- Jessi Colter (American country music artist) she was born in 25/05/1943
- Pat Hennen (American motorcycle racer) he was born in 27/04/1953
Nearby Schools and Colleges
Schools and campuses linked to Phoenix, AZ. Select a name to open its map and contact details.
| Code | Name | City | ZIP |
|---|---|---|---|
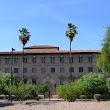
| 105677 | Roberto-Venn School of Luthiery | Phoenix (AZ) | 85007 |
| 448886 | Arizona State University-Downtown Phoenix | Phoenix (AZ) | 85004 |
| 246895 | GateWay Community College-Central City | Phoenix (AZ) | 85034-4101 |
| 456180 | Fortis College-Phoenix | Phoenix (AZ) | 85006 |
| 105428 | Phoenix College | Phoenix (AZ) | 85013 |
Nearby Transit Stations (4)
Rail and bus stations connected to Phoenix, AZ. Select a station to open its map and address details.
| Code | Name | Address | Type |
|---|---|---|---|
| PHG | Phoenix (Greyhound), Arizona | 2115 East Buckeye Road | BUS |
| PHA | Phoenix (Airport), Arizona | 3400 East Sky Harbor Blvd. | BUS |
| PXN | Phoenix (Metro Center Transit Station), Arizona | 9617 North Metro Parkway West | BUS |
| MRC | Maricopa | 19427 N. John Wayne Parkway | RAIL |
Closest post offices linked to Phoenix.
| Post Office Name | City | ZIP |
|---|---|---|
| Downtown Phoenix Post Office | Phoenix (AZ) | 85004 |
| Rio Salad Post Office | Phoenix (AZ) | 85034 |
| Osborn Post Office | Phoenix (AZ) | 85013 |
| Capitol Post Office | Phoenix (AZ) | 85009 |
| South Mountain Post Office | Phoenix (AZ) | 85042 |
Other places with the same name (3)
- Phoenix, Oregon city in Oregon, USA with a population of 4,678 people.
- Phoenix, New York village in Oswego County, United States with a population of 2,225 people.
- Phoenix, Illinois village in United States of America with a population of 1,884 people.
Other cities in Maricopa County
Cities, towns, neighborhoods & other populated places in Maricopa County , AZ. (more)
| City Name | Population | Title |
|---|---|---|
| Mesa | 528,159 | The fourth most populous city in Arizona and the center of the Mesa metropolitan area. |
| Chandler | 265,398 | The second most populous city in Maricopa County, Arizona. |
| Scottsdale | 262,647 | The fourth most populous city in Arizona and the center of the Scottsdale metropolitan area. |
| Gilbert | 257,658 | The fifth most populous city in Arizona. |
| Glendale | 255,307 | The second most populous city in Arizona. |
| Maryvale | 208,189 | Urban village in Phoenix, Arizona, United States |
| Tempe | 200,402 | The third most populous city in Arizona. |
| Peoria | 179,872 | The second most populous city in Maricopa County, Arizona. |
| Tempe Junction | 158,368 | A census-designated place in Maricopa County, Arizona. |
| Surprise | 147,965 | The seventh most populous city in Arizona. |
| Goodyear | 90,622 | The most populous city in Maricopa County, Arizona. |
| Avondale | 88,914 | The most populous city in Maricopa County, Arizona. |
| Buckeye | 85,224 | Town in Maricopa County, Arizona |
| Queen Creek | 60,097 | Town in Arizona, United States |
| Sun City | 37,499 | Census designated place in Maricopa County, Arizona, United States |
| El Mirage | 36,481 | City in Arizona |
Distance to Other Cities
Phoenix distances to largest Arizona cities