Nicaragua (Republic of Nicaragua), NI
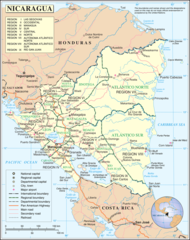
Nicaragua: This Central American nation is the largest country in the isthmus, bordered by Honduras to the north and Costa Rica to the south.
About

Country Snapshot
Republic of Nicaragua at a glance
Republic of Nicaragua currently has 51 quality-checked populated place pages and 16 state or regional pages linked on MapSof.
Mapped cities & towns
51
These counts use a stricter populated-place filter so the main lists stay focused on real city and town pages.
States & regions
16
Open related pagesLargest city
ManaguaPopulation 973,087
Top linked places
Quick Facts about Republic of Nicaragua
| Population | 6,803,886 |
| Country | Nicaragua |
| Plate code | NIC |
| Area | 130375 km2 |
| Official name | la République du Nicaragua, Nicaragua |
| Continent | North America |
| Easternmost point | Point(-82.766666666 14.383333333) |
| Northernmost point | Point(-86.00099 13.09138) |
| Latitude & Longitude | 13.0000,-85.0000 |
| Legislative body | National Assembly |
| Named for | Nicarao |
| Official language | Spanish |
| Capital | Managua |
| Establishment | January 01, 1821 (205 years ago) |
| Time Zone | UTC−06:00 |
| Local time | 09:13:03 (25th July 2026) |

Geography
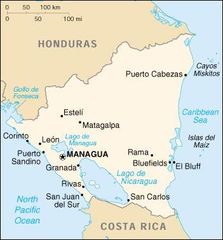
Republic of Nicaragua is located at 13°0'0"N 85°0'0"W (13.0000000, -85.0000000). It has 3 neighbors: Honduras, Costa Rica and Colombia.
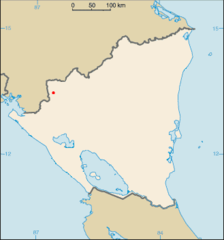
Nicaragua map
The largest city of Republic of Nicaragua is Managua with a population of 973,087. Other cities include, Matagalpa population 156,218, Chinandega population 151,707, Masaya population 130,113 and Estelí population 96,422. See all Republic of Nicaragua cities & populated places.
Official website of Republic of Nicaragua
Official WebsiteCompare Republic of Nicaragua with
- Boaco Department
- Masaya Department
- Chontales Department
- Carazo Department
- Rivas Department
- León Department
- Río San Juan Department
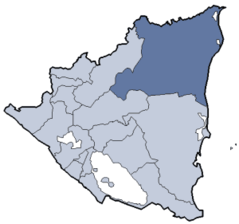
- North Caribbean Coast Autonomous Region
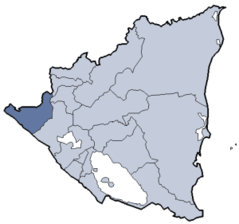
- Chinandega Department
- Estelí Department
- Managua Department
- Nueva Segovia Department
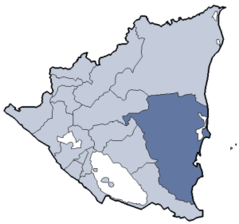
- South Caribbean Coast Autonomous Region
- Jinotega Department
- Matagalpa Department
- Madriz Department
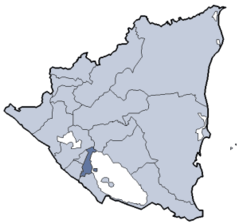
- Granada Department
Demographics
| Year | Population | % Change | Method |
|---|---|---|---|
| 1960 | 1,774,574 | - | census |
| 1961 | 1,830,304 | 3.04% | census |
| 1962 | 1,886,504 | 2.98% | census |
| 1963 | 1,943,602 | 2.94% | census |
| 1964 | 2,002,244 | 2.93% | census |
| 1965 | 2,062,932 | 2.94% | census |
| 1966 | 2,125,773 | 2.96% | census |
| 1967 | 2,190,718 | 2.96% | census |
| 1968 | 2,257,923 | 2.98% | census |
| 1969 | 2,327,542 | 2.99% | census |
| 1970 | 2,399,677 | 3.01% | census |
| 1971 | 2,474,312 | 3.02% | census |
| 1972 | 2,551,425 | 3.02% | census |
| 1973 | 2,631,065 | 3.03% | census |
| 1974 | 2,713,287 | 3.03% | census |
| 1975 | 2,798,048 | 3.03% | census |
| 1976 | 2,885,281 | 3.02% | census |
| 1977 | 2,974,713 | 3.01% | census |
| 1978 | 3,065,820 | 2.97% | census |
| 1979 | 3,157,930 | 2.92% | census |
| 1980 | 3,250,470 | 2.85% | census |
| 1981 | 3,343,536 | 2.78% | census |
| 1982 | 3,437,017 | 2.72% | census |
| 1983 | 3,529,935 | 2.63% | census |
| 1984 | 3,621,067 | 2.52% | census |
| 1985 | 3,709,708 | 2.39% | census |
| 1986 | 3,794,923 | 2.25% | census |
| 1987 | 3,877,325 | 2.13% | census |
| 1988 | 3,959,636 | 2.08% | census |
| 1989 | 4,045,623 | 2.13% | census |
| 1990 | 4,137,788 | 2.23% | census |
| 1991 | 4,237,154 | 2.35% | census |
| 1992 | 4,342,319 | 2.42% | census |
| 1993 | 4,450,371 | 2.43% | census |
| 1994 | 4,557,125 | 2.34% | census |
| 1995 | 4,659,458 | 2.2% | census |
| 1996 | 4,756,631 | 2.04% | census |
| 1997 | 4,849,272 | 1.91% | census |
| 1998 | 4,937,320 | 1.78% | census |
| 1999 | 5,021,079 | 1.67% | census |
| 2000 | 5,100,920 | 1.57% | census |
| 2001 | 5,176,685 | 1.46% | census |
| 2002 | 5,248,577 | 1.37% | census |
| 2003 | 5,317,878 | 1.3% | census |
| 2004 | 5,386,299 | 1.27% | census |
| 2005 | 5,455,219 | 1.26% | census |
| 2006 | 5,524,927 | 1.26% | census |
| 2007 | 5,595,533 | 1.26% | census |
| 2008 | 5,667,983 | 1.28% | census |
| 2009 | 5,743,329 | 1.31% | census |
| 2010 | 5,822,209 | 1.35% | census |
| 2011 | 5,905,146 | 1.4% | census |
| 2012 | 5,991,733 | 1.45% | census |
| 2013 | 6,080,478 | 1.46% | census |
| 2014 | 6,142,733 | 1.01% | (Worldbank) |
| 2015 | 6,223,240 | 1.29% | (Worldbank) |
| 2016 | 6,303,974 | 1.28% | (Worldbank) |
| 2017 | 6,217,581 | -1.39% | census |
| 2018 | 6,465,513 | 3.83% | (Worldbank) |
| 2019 | 6,545,502 | 1.22% | (Worldbank) |
| 2026 | 6,803,886 | 3.8% |
Map & Images (more maps)
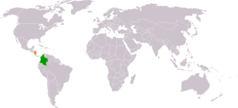
Colombia Nicaragua Locator
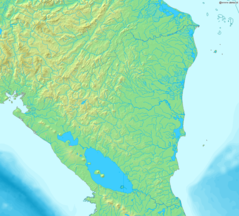
Map of Nicaragua Demis
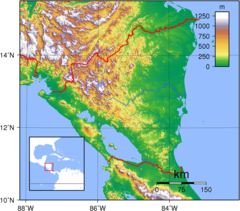
Nicaragua Topography
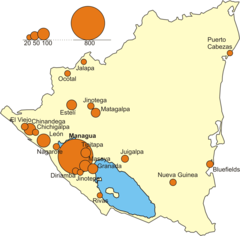
Nicaragua Cities Over 20th Map
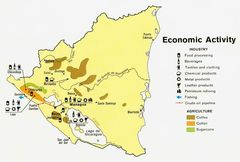
Nicaragua Econ 1979
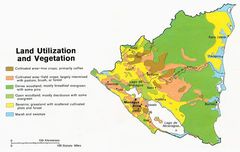
Nicaragua Land 1979
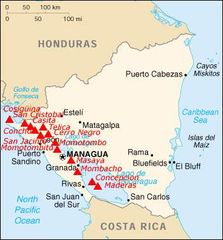
Nicaragua Map Vulcani
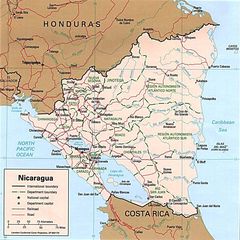
Nicaragua Pol 97
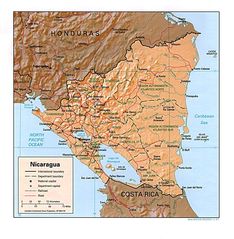
Nicaragua Rel 97
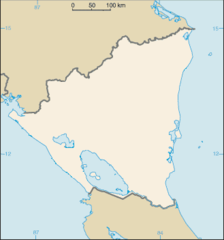
Nicaragua Map Blank
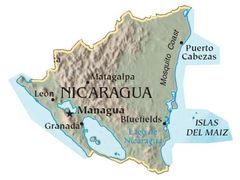
Nicaragua
Nicaraguachinandega
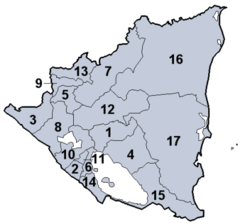
Nicaraguadepartmentsnumbered
Nicaraguagranada
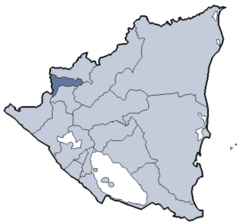
Nicaraguamadriz
Nicaraguaraan
Nicaraguaraas
Nicaraguazelaya
Nu Map En
Somoto (location)