Indian Head, Maryland
Indian Head: town in Charles County, Maryland, United States
About
Indian Head is a town located in the county of Charles in the U.S. state of Maryland. Its population at the 2010 census was 3,844 and a population density of 1,205 people per km². After 10 years in 2020 city had an estimated population of 3,787 inhabitants.
The town was created 106 years ago in 1919.

Quick Facts about Indian Head
| Population | 3,787 (2020) |
| Country | United States of America |
| State | Maryland (United States) |
| County | Charles County |
| Postal code | 20640 |
| Phone Area Codes | 240, 301 |
| Area | 3.19 km2 |
| Latitude & Longitude | 38.6001,-77.1622 |
| Altitude | 105 feet / 32 meters |
| Establishment | January 01, 1920 (106 years ago) |
| Time Zone | Eastern Time Zone, America/New_York |
| Local time | 15:26:13 (24th July 2026) |
| Density | 1,187 Pop. per km² as of 2020 |
| Population growth | -1.51% (2010-2020) |
| Weather | 66℉ Mostly Clear 7-days weather |

Geography
Indian Head is located at 38°36'0"N 77°9'44"W (38.6001200, -77.1622000).
Indian Head map
Weather
Mostly clear, with a low around 66. Northeast wind around 3 mph.
7-Day ForecastOfficial website of Indian Head
Official WebsiteDemographics
According to census records, the population of Indian Head decreased by 1.51% in 10 years.
| Year | Population | % Change | Method |
|---|---|---|---|
| 2010 | 3,844 | - | census |
| 2011 | 3,924 | 2.04% | estimation process |
| 2012 | 3,912 | -0.31% | estimation process |
| 2013 | 3,914 | 0.05% | estimation process |
| 2014 | 3,862 | -1.35% | estimation process |
| 2015 | 3,842 | -0.52% | estimation process |
| 2016 | 3,804 | -1% | estimation process |
| 2017 | 3,801 | -0.08% | estimation process |
| 2018 | 3,806 | 0.13% | estimation process |
| 2019 | 3,802 | -0.11% | estimation process |
| 2020 | 3,787 | -0.4% | estimation process |
Demographic Facts
| Estimated population as of July 1, 2019 : | 263,670 |
| Based on demographic estimates as of April 1, 2010 : | 274,525 |
| Based on demographic estimates as of 1 April 2010 : | -4.0% |
| April 1, 2020 Population : | 274,534 |
| April 1, 2010 Population : | 274,549 |
| People under 5 years old, percentage : | 5.4% |
| People under 18 years old, percentage : | 21.1% |
| People over 65 (%) : | 18.6% |
| Female persons, % : | 51.6% |
| White only, percent : | 71.3% |
| Black or African American alone, percent : | 17.1% |
| American Indian and Alaska Native only, % : | 0.7% |
| Asians alone % : | 8.1% |
| Only Native Hawaiians and Other Pacific Islanders, % : | 0.1% |
| % of people who have participated in two or more races : | 2.7% |
| % of Hispanic or Latino : | 19.4% |
| White people, not Hispanic or Latino people, make up the majority of the population. : | 56.0% |
| 2015-2019 Veterans : | 12,325 |
| Percentage of foreign-born people, 2015-2019 : | 16.5% |
| Residential units, July 1, 2019 : | 128,930 |
Economic Facts
| Residential units, July 1, 2019 : | 128,930 |
| Rate of owner-occupied housing units, 2015-2019 : | 67.1% |
| Owner-occupied housing unit median value, 2015-2019 : | $217,900 |
| From 2015 to 2019, the median selected monthly owner costs - with a mortgage : | $2,013 |
| Monthly owner costs, without a mortgage, at the median, 2015-2019 : | $906 |
| 2015-2019 median gross rent : | $1,120 |
| Permits for construction, 2020 : | 667 |
| 2015-2019 Households : | 99,850 |
| Population per household, 2015-2019 : | 2.61 |
| Living in the same house a year ago, percentage of people aged one year and up, 2015-2019 : | 86.9% |
| Languages other than English spoken at home, as a percentage of people aged 5 and up, 2015-2019 : | 27.0% |
| Households with computers, %, 2015-2019 : | 90.6% |
| Percentage of households with a broadband Internet subscription, 2015-2019 : | 83.4% |
| Percentage of people aged 25 and up with a high school diploma or higher, 2015-2019 : | 87.0% |
| Bachelor's degree or higher, proportion of people aged 25 and up, 2015-2019 : | 28.1% |
| Percentage of people under the age of 65 who have a disability, 2015-2019 : | 9.3% |
| Persons under the age of 65 who do not have health insurance, as a percentage : | 10.7% |
| Total civilian labor force, percent of population aged 16 and up, 2015-2019 : | 64.4% |
| Female labor force participation in the civilian labor force, as a percentage of the population aged 16 and up, 2015-2019 : | 60.8% |
| Total sales of lodging and food services in 2012 ($1,000) : | 4,008,546 |
| Total receipts/revenue for health care and social assistance in 2012 ($1,000) : | 1,969,273 |
| Manufacturers' total shipments in 2012 ($1,000) : | 285,412 |
| 2012 total retail sales ($1,000) : | 4,292,714 |
| 2012 total retail sales per capita : | $15,586 |
| Mean commute time to work (in minutes), workers aged 16 and up, 2015-2019 : | 24.9 |
| 2015-2019 median household income (in 2019 dollars) : | $62,110 |
| Income per capita in the previous 12 months (in 2019 dollars), 2015-2019 : | $33,284 |
| Percentage of people living in poverty : | 11.3% |
| Total number of employer establishments, 2019 : | 6,187 |
| 2019 total employment : | 110,453 |
| 2019 total annual payroll ($1,000) : | 4,638,036 |
| Total employment, change in percentage terms, 2018-2019 : | 3.4% |
| 2018 total non-employer establishments : | 17,834 |
| Total number of businesses in 2012 : | 21,211 |
| Men-owned businesses in 2012 : | 11,850 |
| Women-owned businesses in 2012 : | 7,026 |
| Minority-owned businesses in 2012 : | 4,969 |
| Non-minority-owned businesses in 2012 : | 15,444 |
| Veteran-owned businesses in 2012 : | 1,425 |
| Nonveteran-owned businesses in 2012 : | 18,637 |
| 2010 population per square mile : | 494.1 |
| 2010 land area in square miles : | 555.70 |
Best Things to Do in Indian Head
1Chapman State Park
3452 Ferry Pl, Indian Head, MD 20640, United States View details
Phone: +13017437613 | Website available

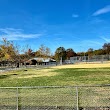
2Village Green Park
100 Walter Thomas Rd, Indian Head, MD 20640, United States View details
Website available

3Charlie Wright Park
101 Dr Mitchell Ln, Indian Head, MD 20640, United States View details
Services and Civic Places in Indian Head
1Indian Head Town Hall
4195 Indian Head Hwy, Indian Head, MD 20640 View details
Phone: +13017435511 | Website available

People born in Indian Head (2)
People born in Indian Head, including poet Katherine Hoskins, admiral Norvell G. Ward, .
More notable people
Nearby Schools and Colleges
Schools and campuses linked to Indian Head, MD. Select a name to open its map and contact details.
| Code | Name | City | ZIP |
|---|---|---|---|
| 480930 | Paul Mitchell the School-Woodbridge | Woodbridge (VA) | 22192 |
Nearby Transit Stations (22)
Rail and bus stations connected to Indian Head, MD. Select a station to open its map and address details.
| Code | Name | Address | Type |
|---|---|---|---|
| WDB | Woodbridge station | 1040 Express Way | RAIL |
| LOR | Lorton station | 8006 Lorton Road | RAIL |
| QAN | Quantico | 550 Railroad Avenue | RAIL |
| ALX | Union Station | 110 Callahan Drive | RAIL |
| BCV | Burke Centre | 10399 Premier Court | RAIL |
Closest post offices linked to Indian Head.
| Post Office Name | City | ZIP |
|---|---|---|
| Indian Head Post Office | Indian Head (MD) | 20640 |
Other cities in Charles County
Cities, towns, neighborhoods & other populated places in Charles County , MD.
| City Name | Population | Title |
|---|---|---|
| Waldorf | 67,752 | Census designated place |
| Saint Charles | 36,376 | City in St. |
| Bennsville | 11,923 | Census designated place in Maryland, United States |
| La Plata | 9,800 | Town in Maryland, United States |
| Bryans Road | 7,244 | Census designated place |
| Middletown | 4,910 | Town in Maryland, USA |
| Potomac Heights | 1,117 | Census designated place |
Distance to Other Cities
Indian Head distances to largest Maryland cities