Guatemala (Republic of Guatemala), GT
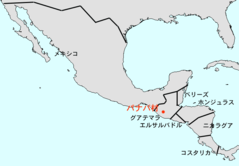
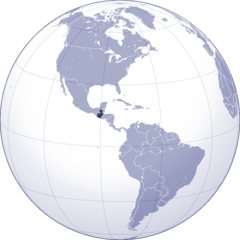
Guatemala: This Central American nation, with an estimated population of 18, 079, 810 and an area of 108, 889 km², is bordered by Mexico to the north and west, Belize and the Caribbean Sea to the northeast, Honduras to the east, El Salvador to the southeast, and the Pacific Ocean to the south.
About

Country Snapshot
Republic of Guatemala at a glance
Republic of Guatemala currently has 241 quality-checked populated place pages and 22 state or regional pages linked on MapSof.
Mapped cities & towns
241
These counts use a stricter populated-place filter so the main lists stay focused on real city and town pages.
States & regions
22
Open related pagesLargest city
Guatemala CityPopulation 994,938
Top linked places
Quick Facts about Republic of Guatemala
| Population | 18,079,810 |
| Country | Guatemala |
| Different from | Guatemala Department |
| Plate code | GCA |
| Area | 108889 km2 |
| Official name | République du Guatémala, Guatemala |
| Continent | North America |
| Easternmost point | Point(-88.231694444 15.724555555) |
| Northernmost point | Point(-90.987833333 17.815694444) |
| Latitude & Longitude | 15.5000,-90.2500 |
| Legislative body | Congress of Guatemala |
| Official language | Spanish |
| Capital | Guatemala City |
| Capital city | Republic of Guatemala is capital of Federal Republic of Central America |
| Establishment | January 01, 1821 (205 years ago) |
| Time Zone | UTC−06:00 |
| Local time | 03:25:31 (26th July 2026) |

Geography
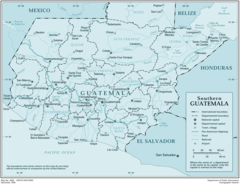
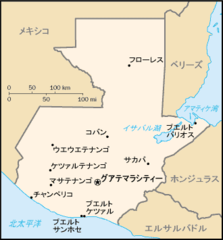
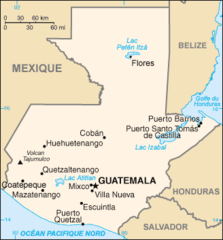
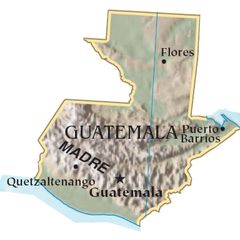
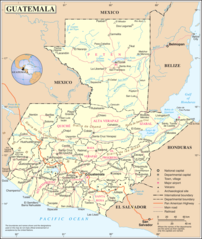
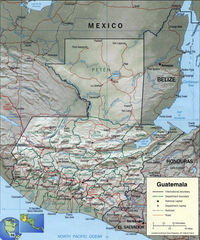
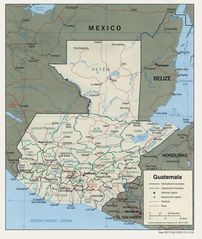
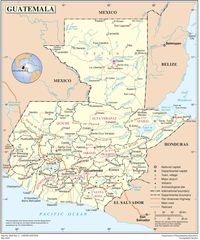
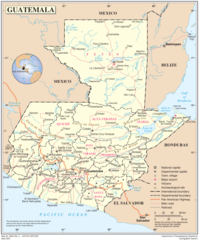
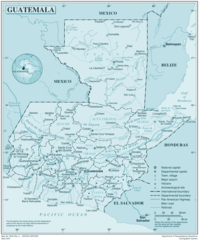
Republic of Guatemala is located at 15°30'0"N 90°15'0"W (15.5000000, -90.2500000). It has 4 neighbors: Belize, El Salvador, Honduras and Mexico.
Guatemala map
The largest city of Republic of Guatemala is Guatemala City with a population of 994,938. Other cities include, Villa Nueva population 406,830, Villa Canales population 122,194, Escuintla population 103,165 and Antigua Guatemala population 39,368. See all Republic of Guatemala cities & populated places.
Official website of Republic of Guatemala
Official WebsiteCompare Republic of Guatemala with
- Jutiapa Department
- Sololá Department
- Santa Rosa Department
- Chimaltenango Department
- Baja Verapaz Department
- Jalapa Department
- Totonicapán Department
- Zacapa Department
- Petén Department
- Huehuetenango Department
- Sacatepéquez Department
- Retalhuleu Department
- El Progreso Department
- Escuintla Department
- Guatemala Department
- Quiché Department
- Quetzaltenango Department
- Suchitepéquez Department
- Alta Verapaz Department
- Chiquimula Department
- Izabal Department
- San Marcos Department
Demographics
| Year | Population | % Change | Method |
|---|---|---|---|
| 1960 | 4,140,636 | - | estimation process |
| 1961 | 4,253,298 | 2.65% | estimation process |
| 1962 | 4,369,153 | 2.65% | |
| 1963 | 4,488,229 | 2.65% | estimation process |
| 1964 | 4,610,494 | 2.65% | estimation process |
| 1965 | 4,735,961 | 2.65% | estimation process |
| 1966 | 4,864,495 | 2.64% | estimation process |
| 1967 | 4,996,199 | 2.64% | estimation process |
| 1968 | 5,131,566 | 2.64% | estimation process |
| 1969 | 5,271,250 | 2.65% | estimation process |
| 1970 | 5,415,616 | 2.67% | estimation process |
| 1971 | 5,565,101 | 2.69% | estimation process |
| 1972 | 5,719,315 | 2.7% | estimation process |
| 1973 | 5,876,798 | 2.68% | estimation process |
| 1974 | 6,035,549 | 2.63% | estimation process |
| 1975 | 6,194,218 | 2.56% | estimation process |
| 1976 | 6,352,074 | 2.49% | estimation process |
| 1977 | 6,509,758 | 2.42% | estimation process |
| 1978 | 6,668,975 | 2.39% | estimation process |
| 1979 | 6,832,183 | 2.39% | estimation process |
| 1980 | 7,001,101 | 2.41% | estimation process |
| 1981 | 7,176,504 | 2.44% | estimation process |
| 1982 | 7,357,730 | 2.46% | |
| 1983 | 7,543,343 | 2.46% | estimation process |
| 1984 | 7,731,210 | 2.43% | estimation process |
| 1985 | 7,919,874 | 2.38% | estimation process |
| 1986 | 8,108,903 | 2.33% | estimation process |
| 1987 | 8,299,070 | 2.29% | estimation process |
| 1988 | 8,491,594 | 2.27% | estimation process |
| 1989 | 8,688,240 | 2.26% | estimation process |
| 1990 | 8,890,329 | 2.27% | estimation process |
| 1991 | 9,098,613 | 2.29% | estimation process |
| 1992 | 9,312,915 | 2.3% | estimation process |
| 1993 | 9,532,550 | 2.3% | estimation process |
| 1994 | 9,756,398 | 2.29% | |
| 1995 | 9,983,861 | 2.28% | estimation process |
| 1996 | 10,214,623 | 2.26% | |
| 1997 | 10,449,636 | 2.25% | estimation process |
| 1998 | 10,691,090 | 2.26% | estimation process |
| 1999 | 10,941,913 | 2.29% | estimation process |
| 2000 | 11,204,183 | 2.34% | estimation process |
| 2001 | 11,478,984 | 2.39% | estimation process |
| 2002 | 11,765,738 | 2.44% | estimation process |
| 2003 | 12,062,835 | 2.46% | |
| 2004 | 12,367,800 | 2.47% | estimation process |
| 2005 | 12,678,919 | 2.45% | estimation process |
| 2006 | 12,995,374 | 2.44% | estimation process |
| 2007 | 13,317,931 | 2.42% | estimation process |
| 2008 | 13,648,307 | 2.42% | estimation process |
| 2009 | 13,988,988 | 2.44% | |
| 2010 | 14,341,576 | 2.46% | estimation process |
| 2011 | 14,706,578 | 2.48% | estimation process |
| 2012 | 15,082,831 | 2.49% | estimation process |
| 2013 | 15,468,203 | 2.49% | estimation process |
| 2014 | 15,306,316 | -1.06% | (Worldbank) |
| 2015 | 15,567,419 | 1.68% | (Worldbank) |
| 2016 | 15,827,690 | 1.64% | (Worldbank) |
| 2017 | 16,087,418 | 1.61% | (Worldbank) |
| 2018 | 17,263,239 | 6.81% | estimation process |
| 2019 | 16,604,026 | -3.97% | (Worldbank) |
| 2026 | 18,079,810 | 8.16% |
Map & Images (more maps)
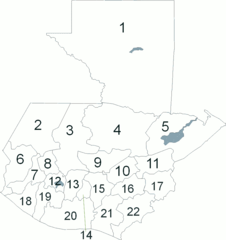
Departmentsofguatemala
Gt Map Ja
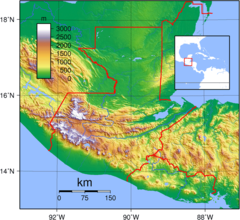
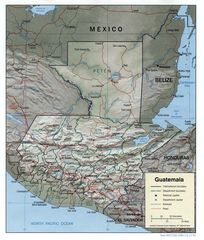
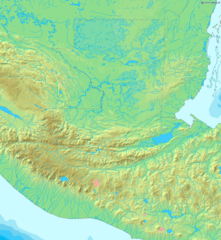
Guatemala Topography
Guatemala Carte
Guatemala Geopolitical
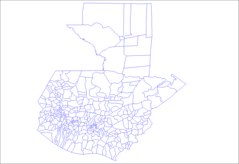
Guatemala Municipalities
Guatemala Cia Wfb Map
Guatemala
Locatoin of Panabaj Ja
Map of Guatemala Demis
Un Guatemala
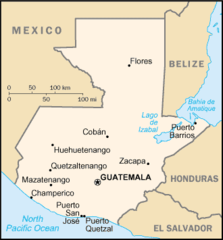
Guatemala Map
Guatemala Political
Guatemala Political Map
Guatemala Political Map 1
Where Is Guatemala Located
Guatemala 2