Cyprus (Republic of Cyprus), CY
Cyprus: Located in the eastern Mediterranean Sea, this island nation is a major tourist destination and a regional financial hub.
About

Country Snapshot
Republic of Cyprus at a glance
Republic of Cyprus currently has 57 quality-checked populated place pages and 6 state or regional pages linked on MapSof.
Mapped cities & towns
57
These counts use a stricter populated-place filter so the main lists stay focused on real city and town pages.
States & regions
6
Open related pagesLargest city
NicosiaPopulation 330,000
Top linked places
Quick Facts about Republic of Cyprus
| Population | 1,442,614 |
| Country | Cyprus |
| Different from | cypress |
| Plate code | CY |
| Area | 9242.45 km2 |
| Official name | la République de Chypre, Κυπριακή Δημοκρατία, Kıbrıs Cumhuriyeti |
| Has part | Famagusta District, Larnaca District, Limassol District, Kyrenia District, Paphos District, Nicosia District |
| Continent | Asia, Europe |
| Easternmost point | Point(34.588611111 35.695) |
| Northernmost point | Point(34.587777777 35.695833333) |
| Latitude & Longitude | 35.0000,33.0000 |
| Legislative body | House of Representatives (Cyprus) |
| Official language | Modern Greek, Greek, Turkish |
| Capital | Nicosia |
| Establishment | August 16, 1960 (65 years ago) |
| Time Zone | UTC+03:00, Eastern European Time, UTC+02:00, Eastern European Summer Time |
| Local time | 12:39:15 (10th June 2026) |

Geography
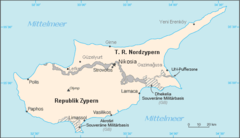
Republic of Cyprus is located at 35°0'0"N 33°0'0"E (35.0000000, 33.0000000).
Cyprus map
The largest city of Republic of Cyprus is Nicosia with a population of 330,000. Other cities include, Limassol population 154,000, Larnaca population 72,000 and Famagusta population 42,526. See all Republic of Cyprus cities & populated places.
Official website of Republic of Cyprus
Official WebsiteCompare Republic of Cyprus with
- Nicosia District
- Famagusta District
- Kyrenia District
- Larnaca District
- Limassol District
- Paphos District
Demographics
| Year | Population | % Change | Method |
|---|---|---|---|
| 1960 | 572,929 | - | demographics |
| 1961 | 576,395 | 0.6% | demographics |
| 1962 | 577,691 | 0.22% | demographics |
| 1963 | 577,912 | 0.04% | demographics |
| 1964 | 578,629 | 0.12% | demographics |
| 1965 | 580,971 | 0.4% | demographics |
| 1966 | 585,311 | 0.74% | demographics |
| 1967 | 591,304 | 1.01% | demographics |
| 1968 | 598,491 | 1.2% | demographics |
| 1969 | 606,117 | 1.26% | demographics |
| 1970 | 613,619 | 1.22% | demographics |
| 1971 | 620,860 | 1.17% | demographics |
| 1972 | 628,000 | 1.14% | demographics |
| 1973 | 635,109 | 1.12% | demographics |
| 1974 | 642,335 | 1.12% | demographics |
| 1975 | 649,755 | 1.14% | demographics |
| 1976 | 657,526 | 1.18% | demographics |
| 1977 | 665,528 | 1.2% | demographics |
| 1978 | 673,252 | 1.15% | demographics |
| 1979 | 680,013 | 0.99% | demographics |
| 1980 | 685,406 | 0.79% | demographics |
| 1981 | 689,173 | 0.55% | demographics |
| 1982 | 691,711 | 0.37% | demographics |
| 1983 | 694,074 | 0.34% | demographics |
| 1984 | 697,717 | 0.52% | demographics |
| 1985 | 703,693 | 0.85% | demographics |
| 1986 | 712,340 | 1.21% | demographics |
| 1987 | 723,380 | 1.53% | demographics |
| 1988 | 736,477 | 1.78% | demographics |
| 1989 | 751,047 | 1.94% | demographics |
| 1990 | 766,611 | 2.03% | demographics |
| 1991 | 783,138 | 2.11% | demographics |
| 1992 | 800,660 | 2.19% | demographics |
| 1993 | 818,814 | 2.22% | demographics |
| 1994 | 837,166 | 2.19% | demographics |
| 1995 | 855,389 | 2.13% | demographics |
| 1996 | 873,246 | 2.04% | demographics |
| 1997 | 890,733 | 1.96% | demographics |
| 1998 | 908,040 | 1.91% | demographics |
| 1999 | 925,491 | 1.89% | demographics |
| 2000 | 943,287 | 1.89% | demographics |
| 2001 | 961,481 | 1.89% | demographics |
| 2002 | 979,877 | 1.88% | demographics |
| 2003 | 998,142 | 1.83% | demographics |
| 2004 | 1,015,820 | 1.74% | demographics |
| 2005 | 1,032,586 | 1.62% | demographics |
| 2006 | 1,048,314 | 1.5% | demographics |
| 2007 | 1,063,095 | 1.39% | demographics |
| 2008 | 1,077,089 | 1.3% | demographics |
| 2009 | 1,090,553 | 1.23% | demographics |
| 2010 | 1,103,685 | 1.19% | demographics |
| 2011 | 1,116,513 | 1.15% | demographics |
| 2012 | 1,128,994 | 1.11% | demographics |
| 2013 | 1,141,166 | 1.07% | demographics |
| 2014 | 1,152,285 | 0.96% | (Worldbank) |
| 2015 | 1,160,985 | 0.75% | (Worldbank) |
| 2016 | 1,170,187 | 0.79% | (Worldbank) |
| 2017 | 1,179,680 | 0.8% | (Worldbank) |
| 2018 | 1,189,265 | 0.81% | (Worldbank) |
| 2019 | 1,198,575 | 0.78% | (Worldbank) |
| 2026 | 1,442,614 | 16.92% |
Map & Images (more maps)
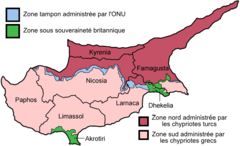
Carte Des Districts De Chypre
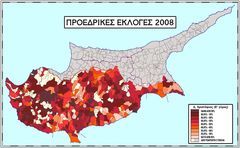
Casoulides 2
Casoulides
Christophias 2
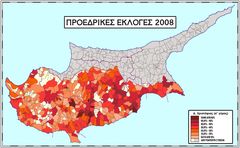
Christophias
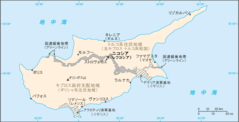
Cy Map Ja
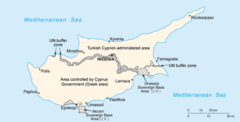
Cy Map
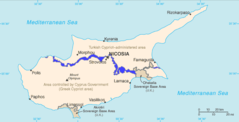
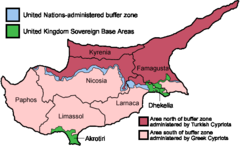
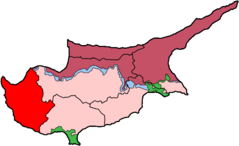
Cyprus Bufferzoneinblue
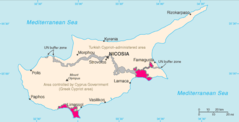
Cyprus Sbasinred
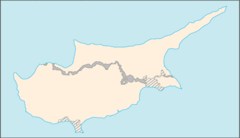
Cyprus Blank Map
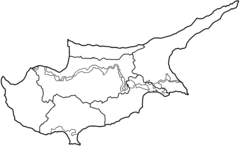
Cyprus Districts Blank
Cyprus Districts Named
Cyprus Districts Only Blank
Cyprus Lrg
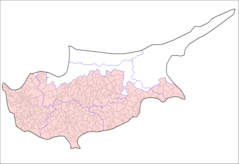
Cyprus Municipalities
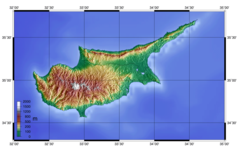
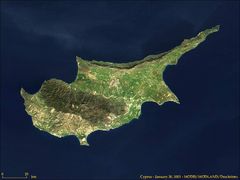
Cyprus Topo
Cyprus Larnaca
Cyprus Limassol
Cyprus Nicosia
Cyprus Paphos