Battle Ground, Indiana
Battle Ground: town in Indiana, United States
About
Battle Ground is a town located in the county of Tippecanoe in the U.S. state of Indiana. Its population at the 2010 census was 1,334 and a population density of 505 people per km². After 10 years in 2020 city had an estimated population of 1,973 inhabitants.
The town was created 159 years ago in 1866.

Quick Facts about Battle Ground
| Population | 1,973 (2020) |
| Country | United States of America |
| State | Indiana (United States) |
| County | Tippecanoe County |
| Postal code | 47920 |
| Phone Area Codes | 765 |
| Area | 2.64 km2 |
| Latitude & Longitude | 40.5084,-86.8417 |
| Altitude | 584 feet / 178 meters |
| Establishment | January 01, 1867 (159 years ago) |
| Time Zone | UTC−05:00 |
| Local time | 15:18:40 (24th July 2026) |
| Density | 747 Pop. per km² as of 2020 |
| Population growth | 32.39% (2010-2020) |
| Weather | 78℉ Partly Sunny 7-days weather |

Geography
Battle Ground is located at 40°30'30"N 86°50'30"W (40.5083700, -86.8416800).
Battle Ground map
Weather
Partly sunny, with a high near 78. East southeast wind around 3 mph.
7-Day ForecastOfficial website of Battle Ground
Official WebsiteDemographics
The population of Battle Ground increased by 32.39% in 10 years.
| Year | Population | % Change | Method |
|---|---|---|---|
| 2010 | 1,334 | - | census |
| 2011 | 1,722 | 22.53% | estimation process |
| 2012 | 1,785 | 3.53% | estimation process |
| 2013 | 1,827 | 2.3% | estimation process |
| 2014 | 1,856 | 1.56% | estimation process |
| 2015 | 1,883 | 1.43% | estimation process |
| 2016 | 1,919 | 1.88% | estimation process |
| 2017 | 1,938 | 0.98% | estimation process |
| 2018 | 1,962 | 1.22% | estimation process |
| 2019 | 1,975 | 0.66% | estimation process |
| 2020 | 1,973 | -0.1% | estimation process |
Demographic Facts
| Estimated population as of July 1, 2019 : | 67,482 |
| Based on demographic estimates as of April 1, 2010 : | 68,551 |
| Based on demographic estimates as of 1 April 2010 : | -1.6% |
| April 1, 2020 Population : | 67,908 |
| April 1, 2010 Population : | 68,557 |
| People under 5 years old, percentage : | 7.1% |
| People under 18 years old, percentage : | 23.7% |
| People over 65 (%) : | 13.6% |
| Female persons, % : | 50.4% |
| White only, percent : | 69.1% |
| Black or African American alone, percent : | 2.8% |
| American Indian and Alaska Native only, % : | 0.3% |
| Asians alone % : | 11.6% |
| Only Native Hawaiians and Other Pacific Islanders, % : | 0.0% |
| % of people who have participated in two or more races : | 3.4% |
| % of Hispanic or Latino : | 20.5% |
| White people, not Hispanic or Latino people, make up the majority of the population. : | 63.2% |
| 2015-2019 Veterans : | 2,227 |
| Percentage of foreign-born people, 2015-2019 : | 26.4% |
| Rate of owner-occupied housing units, 2015-2019 : | 69.0% |
Economic Facts
| Rate of owner-occupied housing units, 2015-2019 : | 69.0% |
| Owner-occupied housing unit median value, 2015-2019 : | $284,400 |
| From 2015 to 2019, the median selected monthly owner costs - with a mortgage : | $2,051 |
| Monthly owner costs, without a mortgage, at the median, 2015-2019 : | $843 |
| 2015-2019 median gross rent : | $1,200 |
| 2015-2019 Households : | 26,866 |
| Population per household, 2015-2019 : | 2.54 |
| Living in the same house a year ago, percentage of people aged one year and up, 2015-2019 : | 85.6% |
| Languages other than English spoken at home, as a percentage of people aged 5 and up, 2015-2019 : | 36.7% |
| Households with computers, %, 2015-2019 : | 94.6% |
| Percentage of households with a broadband Internet subscription, 2015-2019 : | 90.3% |
| Percentage of people aged 25 and up with a high school diploma or higher, 2015-2019 : | 90.6% |
| Bachelor's degree or higher, proportion of people aged 25 and up, 2015-2019 : | 50.0% |
| Percentage of people under the age of 65 who have a disability, 2015-2019 : | 4.4% |
| Persons under the age of 65 who do not have health insurance, as a percentage : | 11.2% |
| Total civilian labor force, percent of population aged 16 and up, 2015-2019 : | 73.3% |
| Female labor force participation in the civilian labor force, as a percentage of the population aged 16 and up, 2015-2019 : | 66.1% |
| Total sales of lodging and food services in 2012 ($1,000) : | 79,955 |
| Total receipts/revenue for health care and social assistance in 2012 ($1,000) : | 116,461 |
| Manufacturers' total shipments in 2012 ($1,000) : | 566,440 |
| 2012 total retail sales ($1,000) : | 853,217 |
| 2012 total retail sales per capita : | $12,340 |
| Mean commute time to work (in minutes), workers aged 16 and up, 2015-2019 : | 29.7 |
| 2015-2019 median household income (in 2019 dollars) : | $80,526 |
| Income per capita in the previous 12 months (in 2019 dollars), 2015-2019 : | $43,958 |
| Percentage of people living in poverty : | 9.8% |
| Total number of businesses in 2012 : | 6,867 |
| Men-owned businesses in 2012 : | 3,952 |
| Women-owned businesses in 2012 : | 2,196 |
| Minority-owned businesses in 2012 : | 1,217 |
| Non-minority-owned businesses in 2012 : | 5,458 |
| Veteran-owned businesses in 2012 : | 492 |
| Nonveteran-owned businesses in 2012 : | 6,144 |
| 2010 population per square mile : | 5,034.8 |
| 2010 land area in square miles : | 13.62 |
| Rate of owner-occupied housing units, 2015-2019 : | 75.4% |
| Owner-occupied housing unit median value, 2015-2019 : | $142,900 |
| From 2015 to 2019, the median selected monthly owner costs - with a mortgage : | $1,505 |
| Monthly owner costs, without a mortgage, at the median, 2015-2019 : | $617 |
| 2015-2019 median gross rent : | $1,334 |
| 2015-2019 Households : | 8,334 |
| Population per household, 2015-2019 : | 3.28 |
| Living in the same house a year ago, percentage of people aged one year and up, 2015-2019 : | 89.0% |
| Languages other than English spoken at home, as a percentage of people aged 5 and up, 2015-2019 : | 46.2% |
| Households with computers, %, 2015-2019 : | 92.7% |
| Percentage of households with a broadband Internet subscription, 2015-2019 : | 88.1% |
| Percentage of people aged 25 and up with a high school diploma or higher, 2015-2019 : | 78.4% |
| Bachelor's degree or higher, proportion of people aged 25 and up, 2015-2019 : | 17.6% |
| Percentage of people under the age of 65 who have a disability, 2015-2019 : | 6.2% |
| Persons under the age of 65 who do not have health insurance, as a percentage : | 13.4% |
| Total civilian labor force, percent of population aged 16 and up, 2015-2019 : | 71.7% |
| Female labor force participation in the civilian labor force, as a percentage of the population aged 16 and up, 2015-2019 : | 65.9% |
| Total sales of lodging and food services in 2012 ($1,000) : | 31,474 |
| Total receipts/revenue for health care and social assistance in 2012 ($1,000) : | 24,086 |
| 2012 total retail sales ($1,000) : | 323,564 |
| 2012 total retail sales per capita : | $11,508 |
| Mean commute time to work (in minutes), workers aged 16 and up, 2015-2019 : | 31.9 |
| 2015-2019 median household income (in 2019 dollars) : | $70,474 |
| Income per capita in the previous 12 months (in 2019 dollars), 2015-2019 : | $26,436 |
| Percentage of people living in poverty : | 9.8% |
| Total number of businesses in 2012 : | 1,506 |
| Men-owned businesses in 2012 : | 819 |
| Women-owned businesses in 2012 : | 513 |
| Minority-owned businesses in 2012 : | 599 |
| Non-minority-owned businesses in 2012 : | 833 |
| Veteran-owned businesses in 2012 : | 90 |
| Nonveteran-owned businesses in 2012 : | 1,356 |
| 2010 population per square mile : | 5,565.2 |
| 2010 land area in square miles : | 5.06 |
| Rate of owner-occupied housing units, 2015-2019 : | 75.2% |
| Owner-occupied housing unit median value, 2015-2019 : | $151,500 |
| From 2015 to 2019, the median selected monthly owner costs - with a mortgage : | $1,343 |
| Monthly owner costs, without a mortgage, at the median, 2015-2019 : | $302 |
| 2015-2019 median gross rent : | $757 |
| 2015-2019 Households : | 2,944 |
| Population per household, 2015-2019 : | 2.76 |
| Living in the same house a year ago, percentage of people aged one year and up, 2015-2019 : | 83.7% |
| Languages other than English spoken at home, as a percentage of people aged 5 and up, 2015-2019 : | 15.3% |
| Households with computers, %, 2015-2019 : | 84.5% |
| Percentage of households with a broadband Internet subscription, 2015-2019 : | 77.7% |
| Percentage of people aged 25 and up with a high school diploma or higher, 2015-2019 : | 83.4% |
| Bachelor's degree or higher, proportion of people aged 25 and up, 2015-2019 : | 18.2% |
| Percentage of people under the age of 65 who have a disability, 2015-2019 : | 8.5% |
| Persons under the age of 65 who do not have health insurance, as a percentage : | 11.6% |
| Total civilian labor force, percent of population aged 16 and up, 2015-2019 : | 58.9% |
| Female labor force participation in the civilian labor force, as a percentage of the population aged 16 and up, 2015-2019 : | 57.9% |
| Total sales of lodging and food services in 2012 ($1,000) : | 37,102 |
| Total receipts/revenue for health care and social assistance in 2012 ($1,000) : | 50,697 |
| Manufacturers' total shipments in 2012 ($1,000) : | 6,615 |
| 2012 total retail sales ($1,000) : | 375,405 |
| 2012 total retail sales per capita : | $45,714 |
| Mean commute time to work (in minutes), workers aged 16 and up, 2015-2019 : | 26.0 |
| 2015-2019 median household income (in 2019 dollars) : | $43,758 |
| Income per capita in the previous 12 months (in 2019 dollars), 2015-2019 : | $24,749 |
| Percentage of people living in poverty : | 20.9% |
| Total number of businesses in 2012 : | 1,165 |
| Men-owned businesses in 2012 : | 455 |
| Women-owned businesses in 2012 : | 514 |
| Minority-owned businesses in 2012 : | 398 |
| Non-minority-owned businesses in 2012 : | 740 |
| Veteran-owned businesses in 2012 : | 91 |
| Nonveteran-owned businesses in 2012 : | 1,042 |
| 2010 population per square mile : | 1,054.9 |
| 2010 land area in square miles : | 7.72 |
Best Things to Do in Battle Ground
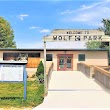
1Wolf Park
4004 E 800 N, Battle Ground, IN 47920, United States View details
Phone: +17655672265 | Website available
2Museums At Prophetstown
3534 Prophetstown Rd, Battle Ground, IN 47920, United States View details
Phone: +17655674700 | Website available

People born in Battle Ground (1)
United States Marine Corps Medal of Honor recipient David M. Shoup was born in Battle Ground
Nearby Schools and Colleges
Schools and campuses linked to Battle Ground, IN. Select a name to open its map and contact details.
| Code | Name | City | ZIP |
|---|---|---|---|
| 152497 | Saint Elizabeth School of Nursing | Lafayette (IN) | 47904-9988 |
Nearby Transit Stations (9)
Rail and bus stations connected to Battle Ground, IN. Select a station to open its map and address details.
| Code | Name | Address | Type |
|---|---|---|---|
| LAF | Lafayette station | 200 North 2nd St. | RAIL |
| CRB | Crawfordsville (Bus), Indiana | 1000 Smith Ave | BUS |
| CRF | Crawfordsville | Spring and Green Streets | RAIL |
| REN | Rensselaer | 619 North Cullen Street | RAIL |
| DVI | Danville, Illinois | 379 Lynch Road | BUS |
Closest post offices linked to Battle Ground.
| Post Office Name | City | ZIP |
|---|---|---|
| Battle Ground Post Office | Battle Ground (IN) | 47920 |
Other places with the same name (1)
- Battle Ground, Washington city in Clark County, Washington with a population of 21,712 people.
Other cities in Tippecanoe County
Cities, towns, neighborhoods & other populated places in Tippecanoe County , IN.
| City Name | Population | Title |
|---|---|---|
| Lafayette | 71,484 | The most populous city in Tippecanoe County, Indiana. |
| West Lafayette | 51,605 | The most populous city in Tippecanoe County, Indiana. |
| Buck Creek | 9,362 | Census-designated place in Tippecanoe County, Indiana |
| Shadeland | 1,784 | City in Tippecanoe County, Indiana, United States of America |
| Dayton | 1,667 | Town in Indiana, USA |
| Taylor | 798 | City in Indiana, United States of America |
| Clarks Hill | 734 | City in Tippecanoe County, Indiana, United States of America |
Distance to Other Cities
Battle Ground distances to largest Indiana cities