Gifford, South Carolina
Gifford: human settlement in Hampton County, South Carolina, United States of America
About
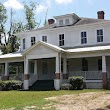
Gifford is a city located in the county of Hampton in the U.S. state of South Carolina. Its population at the 2010 census was 288 and a population density of 115 people per km². After 10 years in 2020 city had an estimated population of 261 inhabitants.
Quick Facts about Gifford
| Population | 261 (2020) |
| Country | United States of America |
| State | South Carolina (United States) |
| County | Hampton County |
| Postal code | 29923 |
| Phone Area Codes | 803 |
| Area | 2.5 km2 |
| Latitude & Longitude | 32.8596,-81.2390 |
| Altitude | 138 feet / 42 meters |
| Time Zone | America/New_York |
| Local time | 13:52:21 (3rd August 2026) |
| Density | 104 Pop. per km² as of 2020 |
| Population growth | -10.34% (2010-2020) |
| Weather | 88℉ Chance Showers And Thunderstorms 7-days weather |
Geography
Gifford is located at 32°51'35"N 81°14'20"W (32.8596100, -81.2389900).
Gifford map
Weather
Rain showers likely before 11am, then a chance of showers and thunderstorms between 11am and 2pm, then showers and thunderstorms likely. Partly sunny,...
7-Day ForecastOfficial website of Gifford
Official WebsiteDemographics
According to census records, the population of Gifford decreased by 10.34% in 10 years.
| Year | Population | % Change | Method |
|---|---|---|---|
| 2010 | 288 | - | census |
| 2011 | 282 | -2.13% | estimation process |
| 2012 | 282 | 0% | estimation process |
| 2013 | 277 | -1.81% | estimation process |
| 2014 | 276 | -0.36% | estimation process |
| 2015 | 272 | -1.47% | estimation process |
| 2016 | 269 | -1.12% | estimation process |
| 2017 | 266 | -1.13% | estimation process |
| 2018 | 265 | -0.38% | estimation process |
| 2019 | 263 | -0.76% | estimation process |
| 2020 | 261 | -0.77% | estimation process |
Demographic Facts
| Estimated population as of July 1, 2019 : | 94,054 |
| Based on demographic estimates as of April 1, 2010 : | 81,130 |
| Based on demographic estimates as of 1 April 2010 : | 15.9% |
| April 1, 2020 Population : | 94,428 |
| April 1, 2010 Population : | 81,405 |
| People under 5 years old, percentage : | 7.0% |
| People under 18 years old, percentage : | 25.5% |
| People over 65 (%) : | 14.7% |
| Female persons, % : | 51.5% |
| White only, percent : | 80.2% |
| Black or African American alone, percent : | 5.3% |
| American Indian and Alaska Native only, % : | 2.0% |
| Asians alone % : | 3.4% |
| Only Native Hawaiians and Other Pacific Islanders, % : | 0.0% |
| % of people who have participated in two or more races : | 7.7% |
| % of Hispanic or Latino : | 6.6% |
| White people, not Hispanic or Latino people, make up the majority of the population. : | 75.4% |
| 2015-2019 Veterans : | 5,600 |
| Percentage of foreign-born people, 2015-2019 : | 6.4% |
| Rate of owner-occupied housing units, 2015-2019 : | 68.2% |
Economic Facts
| Rate of owner-occupied housing units, 2015-2019 : | 68.2% |
| Owner-occupied housing unit median value, 2015-2019 : | $240,600 |
| From 2015 to 2019, the median selected monthly owner costs - with a mortgage : | $1,790 |
| Monthly owner costs, without a mortgage, at the median, 2015-2019 : | $675 |
| 2015-2019 median gross rent : | $1,047 |
| 2015-2019 Households : | 34,050 |
| Population per household, 2015-2019 : | 2.66 |
| Living in the same house a year ago, percentage of people aged one year and up, 2015-2019 : | 81.7% |
| Languages other than English spoken at home, as a percentage of people aged 5 and up, 2015-2019 : | 8.3% |
| Households with computers, %, 2015-2019 : | 95.4% |
| Percentage of households with a broadband Internet subscription, 2015-2019 : | 91.5% |
| Percentage of people aged 25 and up with a high school diploma or higher, 2015-2019 : | 96.1% |
| Bachelor's degree or higher, proportion of people aged 25 and up, 2015-2019 : | 53.4% |
| Percentage of people under the age of 65 who have a disability, 2015-2019 : | 7.2% |
| Persons under the age of 65 who do not have health insurance, as a percentage : | 8.3% |
| Total civilian labor force, percent of population aged 16 and up, 2015-2019 : | 66.4% |
| Female labor force participation in the civilian labor force, as a percentage of the population aged 16 and up, 2015-2019 : | 60.5% |
| Total sales of lodging and food services in 2012 ($1,000) : | 197,931 |
| Total receipts/revenue for health care and social assistance in 2012 ($1,000) : | 482,473 |
| Manufacturers' total shipments in 2012 ($1,000) : | 78,580 |
| 2012 total retail sales ($1,000) : | 1,154,762 |
| 2012 total retail sales per capita : | $13,604 |
| Mean commute time to work (in minutes), workers aged 16 and up, 2015-2019 : | 22.6 |
| 2015-2019 median household income (in 2019 dollars) : | $81,473 |
| Income per capita in the previous 12 months (in 2019 dollars), 2015-2019 : | $44,721 |
| Percentage of people living in poverty : | 10.1% |
| Total number of businesses in 2012 : | 10,967 |
| Men-owned businesses in 2012 : | 5,724 |
| Women-owned businesses in 2012 : | 3,630 |
| Minority-owned businesses in 2012 : | 1,378 |
| Non-minority-owned businesses in 2012 : | 9,169 |
| Veteran-owned businesses in 2012 : | 1,158 |
| Nonveteran-owned businesses in 2012 : | 9,098 |
| 2010 population per square mile : | 961.2 |
| 2010 land area in square miles : | 84.70 |
| Rate of owner-occupied housing units, 2015-2019 : | 42.2% |
| Owner-occupied housing unit median value, 2015-2019 : | $182,500 |
| From 2015 to 2019, the median selected monthly owner costs - with a mortgage : | $988 |
| Monthly owner costs, without a mortgage, at the median, 2015-2019 : | $376 |
| 2015-2019 median gross rent : | $815 |
| 2015-2019 Households : | 2,456 |
| Population per household, 2015-2019 : | 2.68 |
| Living in the same house a year ago, percentage of people aged one year and up, 2015-2019 : | 71.4% |
| Languages other than English spoken at home, as a percentage of people aged 5 and up, 2015-2019 : | 33.3% |
| Households with computers, %, 2015-2019 : | 83.7% |
| Percentage of households with a broadband Internet subscription, 2015-2019 : | 75.6% |
| Percentage of people aged 25 and up with a high school diploma or higher, 2015-2019 : | 81.6% |
| Bachelor's degree or higher, proportion of people aged 25 and up, 2015-2019 : | 17.5% |
| Percentage of people under the age of 65 who have a disability, 2015-2019 : | 14.0% |
| Persons under the age of 65 who do not have health insurance, as a percentage : | 14.8% |
| Total civilian labor force, percent of population aged 16 and up, 2015-2019 : | 61.6% |
| Female labor force participation in the civilian labor force, as a percentage of the population aged 16 and up, 2015-2019 : | 58.5% |
| Total sales of lodging and food services in 2012 ($1,000) : | 15,779 |
| Total receipts/revenue for health care and social assistance in 2012 ($1,000) : | 44,908 |
| 2012 total retail sales ($1,000) : | 100,339 |
| 2012 total retail sales per capita : | $15,799 |
| Mean commute time to work (in minutes), workers aged 16 and up, 2015-2019 : | 21.3 |
| 2015-2019 median household income (in 2019 dollars) : | $34,858 |
| Income per capita in the previous 12 months (in 2019 dollars), 2015-2019 : | $19,921 |
| Percentage of people living in poverty : | 21.8% |
| Total number of businesses in 2012 : | 463 |
| Men-owned businesses in 2012 : | 237 |
| Women-owned businesses in 2012 : | 129 |
| Minority-owned businesses in 2012 : | 82 |
| Non-minority-owned businesses in 2012 : | 336 |
| Veteran-owned businesses in 2012 : | F |
| Nonveteran-owned businesses in 2012 : | 402 |
| 2010 population per square mile : | 1,205.4 |
| 2010 land area in square miles : | 5.02 |
Services and Civic Places in Gifford
1Gifford Town Hall
16 Edward Maude St, Gifford, SC 29923 View details
Phone: +18036252712 | Website available
Nearby Schools and Colleges
Schools and campuses linked to Gifford, SC. Select a name to open its map and contact details.
| Code | Name | City | ZIP |
|---|---|---|---|
| 218681 | University of South Carolina-Salkehatchie | Allendale (SC) | 29810-0617 |
| 218919 | Voorhees College | Denmark (SC) | 29042 |
| 217989 | Denmark Technical College | Denmark (SC) | 29042 |
Nearby Transit Stations (4)
Rail and bus stations connected to Gifford, SC. Select a station to open its map and address details.
| Code | Name | Address | Type |
|---|---|---|---|
| YEM | Yemassee | 9 Main Street | RAIL |
| DNK | Denmark | 200 West Baruch Street | RAIL |
| SAV | Savannah | 2611 Seaboard Coastline Drive | RAIL |
| CHS | Charleston, South Carolina | 4565 Gaynor Avenue | RAIL |
Closest post offices linked to Gifford.
| Post Office Name | City | ZIP |
|---|---|---|
| Gifford Post Office | Gifford (SC) | 29923 |
| Luray Post Office | Luray (SC) | 29932 |
| Brunson Post Office | Brunson (SC) | 29911 |
| Estill Post Office | Estill (SC) | 29918 |
| Fairfax Post Office | Fairfax (SC) | 29827 |
Other places with the same name (2)
- Gifford, Florida census-designated place in Indian River County, Florida with a population of 9,590 people.
- Gifford, Illinois human settlement in Illinois, United States of America with a population of 1,035 people.
Other cities in Hampton County
Cities, towns, neighborhoods & other populated places in Hampton County , SC.
| City Name | Population | Title |
|---|---|---|
| Hampton | 2,488 | City in South Carolina |
| Varnville | 1,949 | City in Hampton County, South Carolina, United States of America |
| Estill | 1,845 | City in Hampton County, South Carolina, United States of America |
| Yemassee | 1,133 | Town in Beaufort and Hampton Counties, South Carolina |
| Brunson | 493 | Human settlement in Hampton County, South Carolina, United States of America |
| Furman | 218 | Human settlement in Hampton County, South Carolina, United States of America |
| Scotia | 198 | Human settlement in Hampton County, South Carolina, United States of America |
| Luray | 116 | Town in South Carolina, United States |