Fraser, Michigan
Fraser: city in Macomb County, Michigan, USA
About
Fraser is a city located in the county of Macomb in the U.S. state of Michigan. Its population at the 2010 census was 14,480 and a population density of 1,345 people per km². After 10 years in 2020 city had an estimated population of 14,331 inhabitants.
The city was created 70 years ago in 1955.

Quick Facts about Fraser
| Population | 14,331 (2020) |
| Country | United States of America |
| State | Michigan (United States) |
| County | Macomb County |
| Postal code | 48026 |
| Phone Area Codes | 586 |
| Area | 10.77 km2 |
| Latitude & Longitude | 42.5392,-82.9494 |
| Altitude | 610 feet / 186 meters |
| Establishment | January 01, 1956 (70 years ago) |
| Time Zone | America/Detroit |
| Local time | 04:02:31 (3rd August 2026) |
| Density | 1,331 Pop. per km² as of 2020 |
| Population growth | -1.04% (2010-2020) |
| Weather | 59℉ Partly Cloudy 7-days weather |
Geography
Fraser is located at 42°32'21"N 82°56'58"W (42.5392000, -82.9493700).
Fraser map
Weather
Partly cloudy. Low around 59, with temperatures rising to around 61 overnight. North wind 7 to 14 mph, with gusts as high as 23 mph.
7-Day ForecastDemographics
According to census records, the population of Fraser decreased by 1.04% in 10 years.
| Year | Population | % Change | Method |
|---|---|---|---|
| 2010 | 14,480 | - | census |
| 2011 | 14,495 | 0.1% | estimation process |
| 2012 | 14,555 | 0.41% | estimation process |
| 2013 | 14,632 | 0.53% | estimation process |
| 2014 | 14,671 | 0.27% | estimation process |
| 2015 | 14,632 | -0.27% | estimation process |
| 2016 | 14,624 | -0.05% | estimation process |
| 2017 | 14,613 | -0.08% | estimation process |
| 2018 | 14,544 | -0.47% | estimation process |
| 2019 | 14,480 | -0.44% | estimation process |
| 2020 | 14,331 | -1.04% | estimation process |
Demographic Facts
| Estimated population as of July 1, 2019 : | 74,232 |
| Based on demographic estimates as of April 1, 2010 : | 71,130 |
| Based on demographic estimates as of 1 April 2010 : | 4.4% |
| April 1, 2020 Population : | 71,959 |
| April 1, 2010 Population : | 71,115 |
| People under 5 years old, percentage : | 5.4% |
| People under 18 years old, percentage : | 16.3% |
| People over 65 (%) : | 9.8% |
| Female persons, % : | 47.0% |
| White only, percent : | 83.5% |
| Black or African American alone, percent : | 7.0% |
| American Indian and Alaska Native only, % : | 0.7% |
| Asians alone % : | 4.9% |
| Only Native Hawaiians and Other Pacific Islanders, % : | 0.3% |
| % of people who have participated in two or more races : | 3.6% |
| % of Hispanic or Latino : | 8.4% |
| White people, not Hispanic or Latino people, make up the majority of the population. : | 76.4% |
| 2015-2019 Veterans : | 5,160 |
| Percentage of foreign-born people, 2015-2019 : | 8.1% |
| Residential units, July 1, 2019 : | 31,409 |
Economic Facts
| Residential units, July 1, 2019 : | 31,409 |
| Rate of owner-occupied housing units, 2015-2019 : | 43.2% |
| Owner-occupied housing unit median value, 2015-2019 : | $201,000 |
| From 2015 to 2019, the median selected monthly owner costs - with a mortgage : | $1,555 |
| Monthly owner costs, without a mortgage, at the median, 2015-2019 : | $592 |
| 2015-2019 median gross rent : | $946 |
| Permits for construction, 2020 : | 225 |
| 2015-2019 Households : | 26,490 |
| Population per household, 2015-2019 : | 2.46 |
| Living in the same house a year ago, percentage of people aged one year and up, 2015-2019 : | 71.3% |
| Languages other than English spoken at home, as a percentage of people aged 5 and up, 2015-2019 : | 11.2% |
| Households with computers, %, 2015-2019 : | 94.8% |
| Percentage of households with a broadband Internet subscription, 2015-2019 : | 88.1% |
| Percentage of people aged 25 and up with a high school diploma or higher, 2015-2019 : | 95.8% |
| Bachelor's degree or higher, proportion of people aged 25 and up, 2015-2019 : | 45.6% |
| Percentage of people under the age of 65 who have a disability, 2015-2019 : | 9.2% |
| Persons under the age of 65 who do not have health insurance, as a percentage : | 10.3% |
| Total civilian labor force, percent of population aged 16 and up, 2015-2019 : | 60.7% |
| Female labor force participation in the civilian labor force, as a percentage of the population aged 16 and up, 2015-2019 : | 64.1% |
| Total sales of lodging and food services in 2012 ($1,000) : | 146,838 |
| Total receipts/revenue for health care and social assistance in 2012 ($1,000) : | 313,188 |
| Manufacturers' total shipments in 2012 ($1,000) : | 94,543 |
| 2012 total retail sales ($1,000) : | 903,931 |
| 2012 total retail sales per capita : | $11,971 |
| Mean commute time to work (in minutes), workers aged 16 and up, 2015-2019 : | 14.7 |
| 2015-2019 median household income (in 2019 dollars) : | $51,208 |
| Income per capita in the previous 12 months (in 2019 dollars), 2015-2019 : | $27,272 |
| Percentage of people living in poverty : | 20.9% |
| Total number of employer establishments, 2019 : | 1,610 |
| 2019 total employment : | 21,030 |
| 2019 total annual payroll ($1,000) : | 676,660 |
| Total employment, change in percentage terms, 2018-2019 : | -0.1% |
| 2018 total non-employer establishments : | 3,588 |
| Total number of businesses in 2012 : | 4,724 |
| Men-owned businesses in 2012 : | 2,443 |
| Women-owned businesses in 2012 : | 1,508 |
| Minority-owned businesses in 2012 : | 380 |
| Non-minority-owned businesses in 2012 : | 4,049 |
| Veteran-owned businesses in 2012 : | 479 |
| Nonveteran-owned businesses in 2012 : | 3,753 |
| 2010 population per square mile : | 116.6 |
| 2010 land area in square miles : | 609.77 |
| Residential units, July 1, 2019 : | 7,030 |
| Rate of owner-occupied housing units, 2015-2019 : | 74.5% |
| Owner-occupied housing unit median value, 2015-2019 : | $70,500 |
| From 2015 to 2019, the median selected monthly owner costs - with a mortgage : | $873 |
| Monthly owner costs, without a mortgage, at the median, 2015-2019 : | $319 |
| 2015-2019 median gross rent : | $581 |
| 2015-2019 Households : | 5,846 |
| Population per household, 2015-2019 : | 2.44 |
| Living in the same house a year ago, percentage of people aged one year and up, 2015-2019 : | 93.4% |
| Languages other than English spoken at home, as a percentage of people aged 5 and up, 2015-2019 : | 5.3% |
| Households with computers, %, 2015-2019 : | 75.3% |
| Percentage of households with a broadband Internet subscription, 2015-2019 : | 64.3% |
| Percentage of people aged 25 and up with a high school diploma or higher, 2015-2019 : | 77.5% |
| Bachelor's degree or higher, proportion of people aged 25 and up, 2015-2019 : | 11.8% |
| Percentage of people under the age of 65 who have a disability, 2015-2019 : | 15.4% |
| Persons under the age of 65 who do not have health insurance, as a percentage : | 18.6% |
| Total civilian labor force, percent of population aged 16 and up, 2015-2019 : | 50.6% |
| Female labor force participation in the civilian labor force, as a percentage of the population aged 16 and up, 2015-2019 : | 44.7% |
| Total receipts/revenue for health care and social assistance in 2012 ($1,000) : | 32,027 |
| Manufacturers' total shipments in 2012 ($1,000) : | 271,109 |
| 2012 total retail sales ($1,000) : | 95,228 |
| 2012 total retail sales per capita : | $6,416 |
| Mean commute time to work (in minutes), workers aged 16 and up, 2015-2019 : | 25.9 |
| 2015-2019 median household income (in 2019 dollars) : | $37,263 |
| Income per capita in the previous 12 months (in 2019 dollars), 2015-2019 : | $19,229 |
| Percentage of people living in poverty : | 17.2% |
| Total number of employer establishments, 2019 : | 255 |
| 2019 total employment : | 2,069 |
| 2019 total annual payroll ($1,000) : | 63,477 |
| Total employment, change in percentage terms, 2018-2019 : | -13.0% |
| 2018 total non-employer establishments : | 947 |
| Total number of businesses in 2012 : | 1,385 |
| Men-owned businesses in 2012 : | 790 |
| Women-owned businesses in 2012 : | 445 |
| Minority-owned businesses in 2012 : | 149 |
| Non-minority-owned businesses in 2012 : | 1,204 |
| Veteran-owned businesses in 2012 : | 139 |
| Nonveteran-owned businesses in 2012 : | 1,189 |
| 2010 population per square mile : | 25.5 |
| 2010 land area in square miles : | 586.57 |
Best Things to Do in Fraser
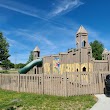
1Fort Fraser
17075 Anita Ave, Fraser, MI 48026, United States View details
Phone: +15862968483 | Website available
2McKinley Barrier Free Park
31500 Grove St, Fraser, MI 48026, United States View details
Phone: +15864534081 | Website available

3Steffens Park
33000 Garfield Rd, Fraser, MI 48026, United States View details
Phone: +15862968483

4Fraser Parks & Recreation
34935 Hidden Pine Dr, Fraser, MI 48026, United States View details
Phone: +15862968483 | Website available

People born in Fraser (5)
People born in Fraser, including ice hockey player Chad LaRose, football player Jim Sorgi, Player of football Charles Davis, .
More notable people
- Dick Colpaert (baseball player) he was born in 03/01/1944
- Maribeth Monroe (American actress, writer and comedian) she was born in 25/03/1978
Nearby Schools and Colleges
Schools and campuses linked to Fraser, MI. Select a name to open its map and contact details.
| Code | Name | City | ZIP |
|---|---|---|---|
| 250744 | Dorsey School of Business-Roseville | Roseville (MI) | 48066 |
| 455558 | Dorsey School of Business-Roseville Culinary Academy | Roseville (MI) | 48066 |
| 170790 | Macomb Community College | Warren (MI) | 48088-3896 |
| 488837 | U.S. Truck Driver Training School | Sterling Heights (MI) | 48312-4518 |
| 449977 | Paul Mitchell the School-Michigan | Sterling Heights (MI) | 48313 |
Nearby Transit Stations (14)
Rail and bus stations connected to Fraser, MI. Select a station to open its map and address details.
| Code | Name | Address | Type |
|---|---|---|---|
| ROY | Royal Oak station | 202 South Sherman Ave. | RAIL |
| BMM | Birmingham, Michigan | 449 South Eton St. | RAIL |
| TRM | Troy Transit Center | 1201 Doyle Drive | RAIL |
| DET | Detroit | 11 West Baltimore Ave. | RAIL |
| PNT | Pontiac Transportation Center | 51000 Woodward Avenue | RAIL |
Closest post offices linked to Fraser.
| Post Office Name | City | ZIP |
|---|---|---|
| Fraser Post Office | Fraser (MI) | 48026 |
Other places with the same name (2)
- Fraser, Colorado town in Colorado, USA with a population of 1,348 people.
- Fraser, Iowa village in Iowa with a population of 103 people.
Other cities in Macomb County
Cities, towns, neighborhoods & other populated places in Macomb County , MI. (more)
| City Name | Population | Title |
|---|---|---|
| Sterling Heights | 131,709 | The second most populous city in Macomb County, Michigan. |
| Clinton Township | 99,753 | A city in Macomb County, Michigan. |
| Macomb | 92,131 | A city in Macomb County, Michigan. |
| Saint Clair Shores | 58,390 | The most populous city in Macomb County, Michigan. |
| Chesterfield | 46,659 | Township in Macomb County, Michigan |
| Roseville | 46,535 | A city in Macomb County, Michigan. |
| Eastpointe | 31,720 | City in Macomb County, Michigan, United States |
| Washington | 28,846 | Township in Macomb County, Michigan |
| Mount Clemens | 16,013 | City in Michigan |
| New Baltimore | 12,281 | City in Macomb County, Michigan, United States |
| Center Line | 8,090 | City in Michigan, United States |
| Utica | 5,062 | City in Michigan, United States |
| New Haven | 5,061 | Village in Michigan |
| Milton | 3,944 | Township in Cass County, Michigan |
| Romeo | 3,572 | Human settlement in Macomb County, Michigan, United States of America |
| Warren | 2,050 | City in the U. |
Distance to Other Cities
Fraser distances to largest Michigan cities