Bolivia (Plurinational State of Bolivia), BO
Bolivia: This landlocked country in western-central South America is characterized by its diverse geography, ranging from the Andes Mountains to the Amazon Basin.
About

Country Snapshot
Plurinational State of Bolivia at a glance
Plurinational State of Bolivia currently has 75 quality-checked populated place pages and 9 state or regional pages linked on MapSof.
Mapped cities & towns
75
These counts use a stricter populated-place filter so the main lists stay focused on real city and town pages.
States & regions
9
Open related pagesLargest city
Santa Cruz de la SierraPopulation 1,364,389
Top linked places
Quick Facts about Plurinational State of Bolivia
| Population | 11,365,333 |
| Country | Bolivia |
| Plate code | BOL |
| Area | 1098581 km2 |
| Official name | l’État plurinational de Bolivie, État plurinational de Bolivie, Estado Plurinacional de Bolivia |
| Continent | South America |
| Easternmost point | Point(-57.4538 -18.23022) |
| Northernmost point | Point(-65.45 -9.67) |
| Latitude & Longitude | -17.0000,-65.0000 |
| Legislative body | Plurinational Legislative Assembly |
| Named for | Simón Bolívar |
| Official language | Spanish, Aymara, Guarani, Quechua |
| Capital | Sucre, La Paz |
| Establishment | January 01, 1825 (201 years ago) |
| Time Zone | UTC−04:00 |
| Local time | 06:11:22 (14th July 2026) |

Geography
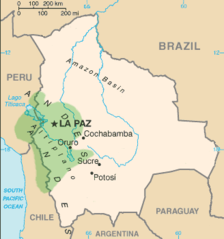
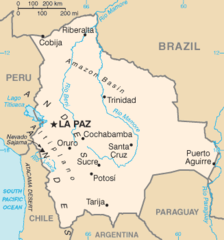
Plurinational State of Bolivia is located at 17°0'0"S 65°0'0"W (-17.0000000, -65.0000000). It has 5 neighbors: Paraguay, Brazil, Argentina, Chile and Peru.
Bolivia map
The largest city of Plurinational State of Bolivia is Cochabamba with a population of 900,414. Other cities include, Sucre population 300,000, Oruro population 208,684, Potosí population 141,251 and Montero population 112,837. See all Plurinational State of Bolivia cities & populated places.
Compare Plurinational State of Bolivia with
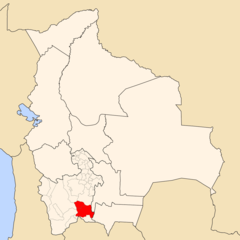
- Tarija Department
- Pando Department
- Potosí Department
- Santa Cruz Department
- Cochabamba Department
- Santa Cruz de la Sierra
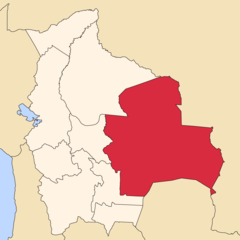
- Beni Department
- Oruro Department
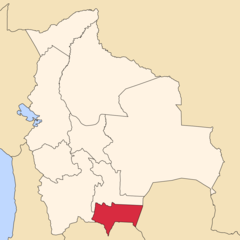
- Chuquisaca Department
- La Paz Department
Demographics
| Year | Population | % Change | Method |
|---|---|---|---|
| 1960 | 3,353,125 | - | estimation process |
| 1961 | 3,428,270 | 2.19% | estimation process |
| 1962 | 3,505,427 | 2.2% | estimation process |
| 1963 | 3,584,782 | 2.21% | estimation process |
| 1964 | 3,666,584 | 2.23% | estimation process |
| 1965 | 3,751,047 | 2.25% | estimation process |
| 1966 | 3,838,156 | 2.27% | estimation process |
| 1967 | 3,927,961 | 2.29% | estimation process |
| 1968 | 4,020,815 | 2.31% | estimation process |
| 1969 | 4,117,153 | 2.34% | estimation process |
| 1970 | 4,217,248 | 2.37% | estimation process |
| 1971 | 4,321,324 | 2.41% | estimation process |
| 1972 | 4,429,194 | 2.44% | estimation process |
| 1973 | 4,540,197 | 2.44% | estimation process |
| 1974 | 4,653,409 | 2.43% | estimation process |
| 1975 | 4,768,177 | 2.41% | estimation process |
| 1976 | 4,884,284 | 2.38% | estimation process |
| 1977 | 5,001,971 | 2.35% | estimation process |
| 1978 | 5,121,608 | 2.34% | estimation process |
| 1979 | 5,243,771 | 2.33% | estimation process |
| 1980 | 5,368,901 | 2.33% | estimation process |
| 1981 | 5,497,112 | 2.33% | estimation process |
| 1982 | 5,628,347 | 2.33% | estimation process |
| 1983 | 5,762,673 | 2.33% | estimation process |
| 1984 | 5,900,127 | 2.33% | estimation process |
| 1985 | 6,040,757 | 2.33% | estimation process |
| 1986 | 6,184,440 | 2.32% | estimation process |
| 1987 | 6,331,219 | 2.32% | estimation process |
| 1988 | 6,481,463 | 2.32% | estimation process |
| 1989 | 6,635,658 | 2.32% | estimation process |
| 1990 | 6,794,046 | 2.33% | estimation process |
| 1991 | 6,956,736 | 2.34% | estimation process |
| 1992 | 7,123,294 | 2.34% | estimation process |
| 1993 | 7,292,745 | 2.32% | estimation process |
| 1994 | 7,463,773 | 2.29% | estimation process |
| 1995 | 7,635,362 | 2.25% | estimation process |
| 1996 | 7,806,953 | 2.2% | estimation process |
| 1997 | 7,978,521 | 2.15% | estimation process |
| 1998 | 8,150,214 | 2.11% | estimation process |
| 1999 | 8,322,408 | 2.07% | estimation process |
| 2000 | 8,495,271 | 2.03% | estimation process |
| 2001 | 8,669,066 | 2% | estimation process |
| 2002 | 8,843,350 | 1.97% | estimation process |
| 2003 | 9,016,787 | 1.92% | estimation process |
| 2004 | 9,187,610 | 1.86% | estimation process |
| 2005 | 9,354,709 | 1.79% | estimation process |
| 2006 | 9,517,395 | 1.71% | estimation process |
| 2007 | 9,676,456 | 1.64% | estimation process |
| 2008 | 9,834,098 | 1.6% | estimation process |
| 2009 | 9,993,406 | 1.59% | estimation process |
| 2010 | 10,156,601 | 1.61% | estimation process |
| 2011 | 10,324,445 | 1.63% | estimation process |
| 2012 | 10,496,285 | 1.64% | estimation process |
| 2013 | 10,671,200 | 1.64% | estimation process |
| 2014 | 10,706,517 | 0.33% | (Worldbank) |
| 2015 | 10,869,730 | 1.5% | (Worldbank) |
| 2016 | 11,031,813 | 1.47% | (Worldbank) |
| 2017 | 11,051,600 | 0.18% | estimation process |
| 2018 | 11,353,142 | 2.66% | (Worldbank) |
| 2019 | 11,513,100 | 1.39% | (Worldbank) |
| 2026 | 11,365,333 | -1.3% |
Map & Images (more maps)
Aymara Language Distributio
Bl Map
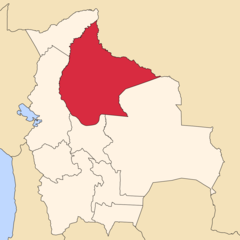
Bolivia Beni
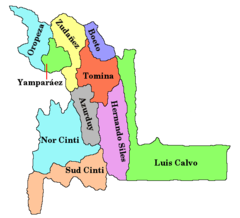
Bolivia Chuquisaca
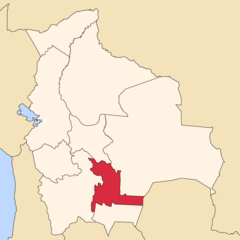
Bolivia Cochabamba
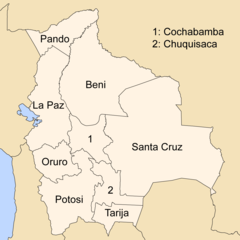
Bolivia Departments
Bolivia Enrique Baldivieso
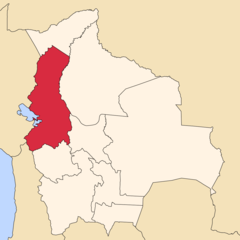
Bolivia La Paz

Bolivia Modesto Omiste
Bolivia Municipios
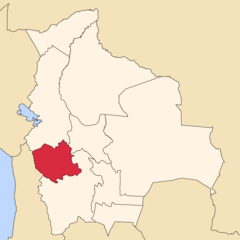
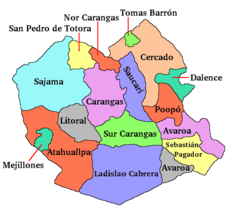
Bolivia Oruro
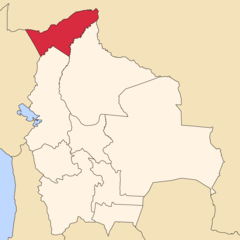
Bolivia Pando
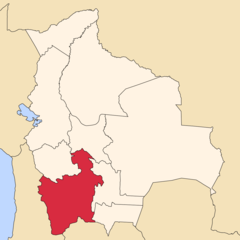
Bolivia Potosi
Bolivia Santa Cruz
Bolivia Sur Chichas
Bolivia Tarija
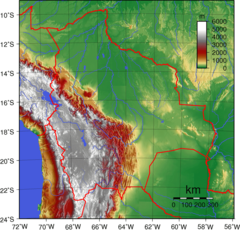
Bolivia Topography
Bolivia Department of Oruro
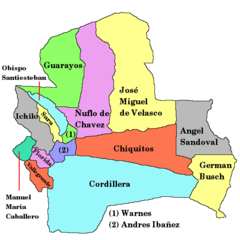
Bolivia Department of Santacruz
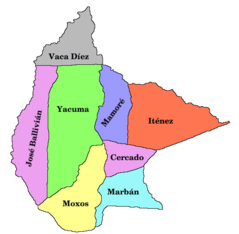
Bolivia Department of Beni