West Jefferson, North Carolina
West Jefferson: town in North Carolina, United States
About
West Jefferson is a town located in the county of Ashe in the U.S. state of North Carolina. Its population at the 2010 census was 1,299 and a population density of 240 people per km². After 10 years in 2020 city had an estimated population of 1,313 inhabitants.
The town was created 117 years ago in 1908.
Quick Facts about West Jefferson
| Population | 1,313 (2020) |
| Country | United States of America |
| State | North Carolina (United States) |
| County | Ashe County |
| Postal code | 28694 |
| Phone Area Codes | 336 |
| Area | 5.41 km2 |
| Latitude & Longitude | 36.4037,-81.4929 |
| Altitude | 2,979 feet / 908 meters |
| Establishment | January 01, 1909 (117 years ago) |
| Time Zone | UTC−05:00 |
| Local time | 01:16:11 (17th July 2026) |
| Density | 243 Pop. per km² as of 2020 |
| Population growth | 1.07% (2010-2020) |
| Weather | 85℉ Chance Showers And Thunderstorms 7-days weather |
Geography
West Jefferson is located at 36°24'13"N 81°29'34"W (36.4037400, -81.4928800).
West Jefferson map
Weather
A slight chance of rain showers between 8am and 11am, then a chance of showers and thunderstorms. Mostly sunny, with a high near 85. Chance of precipi...
7-Day ForecastOfficial website of West Jefferson
Official WebsiteDemographics
The population of West Jefferson increased by 1.07% in 10 years.
| Year | Population | % Change | Method |
|---|---|---|---|
| 2010 | 1,299 | - | census |
| 2011 | 1,317 | 1.37% | estimation process |
| 2012 | 1,314 | -0.23% | estimation process |
| 2013 | 1,310 | -0.31% | estimation process |
| 2014 | 1,305 | -0.38% | estimation process |
| 2015 | 1,297 | -0.62% | estimation process |
| 2016 | 1,290 | -0.54% | estimation process |
| 2017 | 1,298 | 0.62% | estimation process |
| 2018 | 1,311 | 0.99% | estimation process |
| 2019 | 1,315 | 0.3% | estimation process |
| 2020 | 1,313 | -0.15% | estimation process |
Demographic Facts
| Estimated population as of July 1, 2019 : | 6,132 |
| Based on demographic estimates as of April 1, 2010 : | 6,125 |
| Based on demographic estimates as of 1 April 2010 : | 0.1% |
| April 1, 2020 Population : | 6,372 |
| April 1, 2010 Population : | 6,127 |
| People under 5 years old, percentage : | 5.7% |
| People under 18 years old, percentage : | 16.5% |
| People over 65 (%) : | 21.1% |
| Female persons, % : | 51.2% |
| White only, percent : | 85.2% |
| Black or African American alone, percent : | 0.9% |
| American Indian and Alaska Native only, % : | 0.0% |
| Asians alone % : | 10.7% |
| Only Native Hawaiians and Other Pacific Islanders, % : | 0.0% |
| % of people who have participated in two or more races : | 2.1% |
| % of Hispanic or Latino : | 24.4% |
| White people, not Hispanic or Latino people, make up the majority of the population. : | 63.3% |
| 2015-2019 Veterans : | 210 |
| Percentage of foreign-born people, 2015-2019 : | 36.1% |
| Rate of owner-occupied housing units, 2015-2019 : | 63.1% |
Economic Facts
| Rate of owner-occupied housing units, 2015-2019 : | 63.1% |
| Owner-occupied housing unit median value, 2015-2019 : | $408,600 |
| From 2015 to 2019, the median selected monthly owner costs - with a mortgage : | $2,680 |
| Monthly owner costs, without a mortgage, at the median, 2015-2019 : | $958 |
| 2015-2019 median gross rent : | $1,290 |
| 2015-2019 Households : | 2,414 |
| Population per household, 2015-2019 : | 2.56 |
| Living in the same house a year ago, percentage of people aged one year and up, 2015-2019 : | 94.6% |
| Languages other than English spoken at home, as a percentage of people aged 5 and up, 2015-2019 : | 47.0% |
| Households with computers, %, 2015-2019 : | 91.8% |
| Percentage of households with a broadband Internet subscription, 2015-2019 : | 86.5% |
| Percentage of people aged 25 and up with a high school diploma or higher, 2015-2019 : | 87.0% |
| Bachelor's degree or higher, proportion of people aged 25 and up, 2015-2019 : | 37.3% |
| Percentage of people under the age of 65 who have a disability, 2015-2019 : | 4.7% |
| Persons under the age of 65 who do not have health insurance, as a percentage : | 10.3% |
| Total civilian labor force, percent of population aged 16 and up, 2015-2019 : | 65.1% |
| Female labor force participation in the civilian labor force, as a percentage of the population aged 16 and up, 2015-2019 : | 61.1% |
| Total sales of lodging and food services in 2012 ($1,000) : | 36,961 |
| Manufacturers' total shipments in 2012 ($1,000) : | 952,531 |
| 2012 total retail sales ($1,000) : | 114,785 |
| 2012 total retail sales per capita : | $18,165 |
| Mean commute time to work (in minutes), workers aged 16 and up, 2015-2019 : | 28.3 |
| 2015-2019 median household income (in 2019 dollars) : | $88,827 |
| Income per capita in the previous 12 months (in 2019 dollars), 2015-2019 : | $40,791 |
| Percentage of people living in poverty : | 5.6% |
| Total number of businesses in 2012 : | 1,115 |
| Men-owned businesses in 2012 : | 662 |
| Women-owned businesses in 2012 : | 264 |
| Minority-owned businesses in 2012 : | 354 |
| Non-minority-owned businesses in 2012 : | 677 |
| Veteran-owned businesses in 2012 : | 67 |
| Nonveteran-owned businesses in 2012 : | 938 |
| 2010 population per square mile : | 1,532.1 |
| 2010 land area in square miles : | 4.00 |
| Rate of owner-occupied housing units, 2015-2019 : | 46.7% |
| Owner-occupied housing unit median value, 2015-2019 : | $109,400 |
| From 2015 to 2019, the median selected monthly owner costs - with a mortgage : | $1,210 |
| Monthly owner costs, without a mortgage, at the median, 2015-2019 : | $553 |
| 2015-2019 median gross rent : | $754 |
| 2015-2019 Households : | 6,657 |
| Population per household, 2015-2019 : | 2.36 |
| Living in the same house a year ago, percentage of people aged one year and up, 2015-2019 : | 73.6% |
| Languages other than English spoken at home, as a percentage of people aged 5 and up, 2015-2019 : | 3.0% |
| Households with computers, %, 2015-2019 : | 87.2% |
| Percentage of households with a broadband Internet subscription, 2015-2019 : | 71.3% |
| Percentage of people aged 25 and up with a high school diploma or higher, 2015-2019 : | 89.7% |
| Bachelor's degree or higher, proportion of people aged 25 and up, 2015-2019 : | 27.6% |
| Percentage of people under the age of 65 who have a disability, 2015-2019 : | 11.2% |
| Persons under the age of 65 who do not have health insurance, as a percentage : | 2.6% |
| Total civilian labor force, percent of population aged 16 and up, 2015-2019 : | 57.9% |
| Female labor force participation in the civilian labor force, as a percentage of the population aged 16 and up, 2015-2019 : | 57.5% |
| Total sales of lodging and food services in 2012 ($1,000) : | 70,916 |
| Total receipts/revenue for health care and social assistance in 2012 ($1,000) : | 176,060 |
| Manufacturers' total shipments in 2012 ($1,000) : | 280,545 |
| 2012 total retail sales ($1,000) : | 196,883 |
| 2012 total retail sales per capita : | $10,205 |
| Mean commute time to work (in minutes), workers aged 16 and up, 2015-2019 : | 17.3 |
| 2015-2019 median household income (in 2019 dollars) : | $44,317 |
| Income per capita in the previous 12 months (in 2019 dollars), 2015-2019 : | $21,948 |
| Percentage of people living in poverty : | 27.0% |
| Total number of businesses in 2012 : | 1,047 |
| Men-owned businesses in 2012 : | 538 |
| Women-owned businesses in 2012 : | 285 |
| Minority-owned businesses in 2012 : | 63 |
| Non-minority-owned businesses in 2012 : | 898 |
| Veteran-owned businesses in 2012 : | 113 |
| Nonveteran-owned businesses in 2012 : | 776 |
| 2010 population per square mile : | 4,931.7 |
| 2010 land area in square miles : | 3.89 |
Best Things to Do in West Jefferson
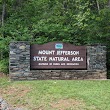
1Mount Jefferson State Natural Area
State, Park Road, 8448, 1481 Mt Jefferson Rd, West Jefferson, NC 28694, United States View details
Phone: +13362469653 | Website available
Nearby Schools and Colleges
Schools and campuses linked to West Jefferson, NC. Select a name to open its map and contact details.
| Code | Name | City | ZIP |
|---|---|---|---|
| 197869 | Appalachian State University | Boone (NC) | 28608 |
Nearby Transit Stations (2)
Rail and bus stations connected to West Jefferson, NC. Select a station to open its map and address details.
| Code | Name | Address | Type |
|---|---|---|---|
| WNS | Winston-Salem, North Carolina | 100 West 5th Street | BUS |
| UWS | Winston-Salem State Univ, Winston-Salem, North Car | 601 South Martin Luther King, Jr. Dr | BUS |
Closest post offices linked to West Jefferson.
| Post Office Name | City | ZIP |
|---|---|---|
| West Jefferson Post Office | West Jefferson (NC) | 28694 |
Other places with the same name (2)
- West Jefferson, Ohio city in Jefferson County, Alabama, United States of America with a population of 4,482 people.
- West Jefferson, Alabama human settlement in Jefferson County, Alabama, United States of America with a population of 415 people.
Other cities in Ashe County
Cities, towns, neighborhoods & other populated places in Ashe County , NC.
| City Name | Population | Title |
|---|---|---|
| Jefferson | 1,534 | Town in North Carolina, USA |
| Lansing | 154 | Town in North Carolina, United States |
Distance to Other Cities
West Jefferson distances to largest North Carolina cities