Tajikistan (Republic of Tajikistan), TJ
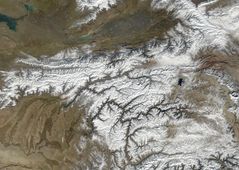
Tajikistan: Nestled in Central Asia, this landlocked nation is defined by its rugged mountains, which cover over 90% of its territory, including the Pamir Mountains.
About

Country Snapshot
Republic of Tajikistan at a glance
Republic of Tajikistan currently has 32 quality-checked populated place pages and 5 state or regional pages linked on MapSof.
Mapped cities & towns
32
These counts use a stricter populated-place filter so the main lists stay focused on real city and town pages.
States & regions
5
Open related pagesLargest city
DushanbePopulation 780,000
Top linked places
Quick Facts about Republic of Tajikistan
| Population | 10,499,000 |
| Country | Tajikistan |
| Plate code | TJ |
| Area | 143100 km2 |
| Official name | República de Tayikistán, la République du Tadjikistan, جمهوری تاجیکستان, Ҷумҳурии Тоҷикистон |
| Continent | Asia |
| Northernmost point | Point(70.43 41.03) |
| Latitude & Longitude | 39.0000,71.0000 |
| Legislative body | Supreme Assembly |
| Official language | Russian, Tajik |
| Capital | Dushanbe |
| Establishment | September 09, 1991 (34 years ago) |
| Time Zone | UTC+05:00 |
| Local time | 18:13:57 (15th July 2026) |

Geography
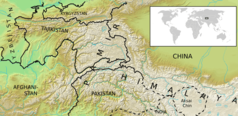
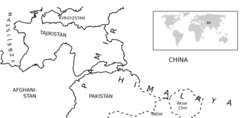
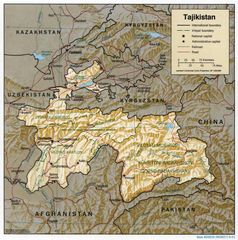
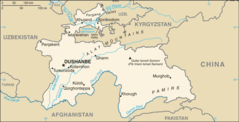
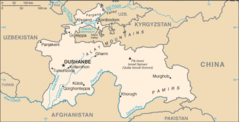
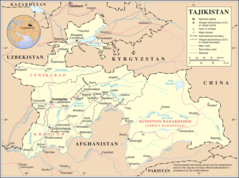
Republic of Tajikistan is located at 39°0'0"N 71°0'0"E (39.0000000, 71.0000000). It has 4 neighbors: Afghanistan, Uzbekistan, Kyrgyzstan and China.
Tajikistan map
The largest city of Republic of Tajikistan is Dushanbe with a population of 780,000. Other cities include, Khujand population 181,600, Kŭlob population 95,000, Konibodom population 50,359 and Tursunzoda population 46,700. See all Republic of Tajikistan cities & populated places.
Compare Republic of Tajikistan with
- Khatlon Province
- Gorno-Badakhshan Autonomous Region
- districts of Republican Subordination
- Sughd Province
Demographics
| Year | Population | % Change | Method |
|---|---|---|---|
| 1950 | 1,532,000 | - | census |
| 1951 | 1,577,000 | 2.85% | census |
| 1952 | 1,626,000 | 3.01% | census |
| 1953 | 1,678,000 | 3.1% | census |
| 1954 | 1,730,000 | 3.01% | census |
| 1955 | 1,783,000 | 2.97% | census |
| 1956 | 1,836,000 | 2.89% | census |
| 1957 | 1,891,000 | 2.91% | census |
| 1958 | 1,949,000 | 2.98% | census |
| 1959 | 1,981,000 | 1.62% | census |
| 1960 | 2,045,000 | 3.13% | census |
| 1961 | 2,121,000 | 3.58% | census |
| 1962 | 2,211,000 | 4.07% | census |
| 1963 | 2,300,000 | 3.87% | census |
| 1964 | 2,402,477 | 4.27% | (Worldbank) |
| 1965 | 2,487,976 | 3.44% | (Worldbank) |
| 1966 | 2,574,511 | 3.36% | (Worldbank) |
| 1967 | 2,662,253 | 3.3% | (Worldbank) |
| 1968 | 2,750,928 | 3.22% | (Worldbank) |
| 1969 | 2,840,262 | 3.15% | (Worldbank) |
| 1970 | 2,930,107 | 3.07% | (Worldbank) |
| 1971 | 3,020,413 | 2.99% | (Worldbank) |
| 1972 | 3,111,282 | 2.92% | (Worldbank) |
| 1973 | 3,203,029 | 2.86% | (Worldbank) |
| 1974 | 3,296,103 | 2.82% | (Worldbank) |
| 1975 | 3,390,941 | 2.8% | (Worldbank) |
| 1976 | 3,487,652 | 2.77% | (Worldbank) |
| 1977 | 3,586,515 | 2.76% | (Worldbank) |
| 1978 | 3,688,419 | 2.76% | (Worldbank) |
| 1979 | 3,794,451 | 2.79% | (Worldbank) |
| 1980 | 3,905,446 | 2.84% | (Worldbank) |
| 1981 | 4,020,821 | 2.87% | (Worldbank) |
| 1982 | 4,140,295 | 2.89% | (Worldbank) |
| 1983 | 4,265,274 | 2.93% | (Worldbank) |
| 1984 | 4,397,562 | 3.01% | (Worldbank) |
| 1985 | 4,537,822 | 3.09% | (Worldbank) |
| 1986 | 4,687,325 | 3.19% | (Worldbank) |
| 1987 | 4,844,002 | 3.23% | (Worldbank) |
| 1988 | 5,001,169 | 3.14% | (Worldbank) |
| 1989 | 5,149,874 | 2.89% | (Worldbank) |
| 1990 | 5,283,814 | 2.53% | (Worldbank) |
| 1991 | 5,400,630 | 2.16% | (Worldbank) |
| 1992 | 5,502,494 | 1.85% | (Worldbank) |
| 1993 | 5,593,315 | 1.62% | (Worldbank) |
| 1994 | 5,679,167 | 1.51% | (Worldbank) |
| 1995 | 5,764,810 | 1.49% | (Worldbank) |
| 1996 | 5,851,355 | 1.48% | (Worldbank) |
| 1997 | 5,938,405 | 1.47% | (Worldbank) |
| 1998 | 6,027,388 | 1.48% | (Worldbank) |
| 1999 | 6,119,661 | 1.51% | (Worldbank) |
| 2000 | 6,216,341 | 1.56% | (Worldbank) |
| 2001 | 6,318,513 | 1.62% | (Worldbank) |
| 2002 | 6,426,867 | 1.69% | (Worldbank) |
| 2003 | 6,541,547 | 1.75% | (Worldbank) |
| 2004 | 6,662,389 | 1.81% | (Worldbank) |
| 2005 | 6,789,321 | 1.87% | (Worldbank) |
| 2006 | 6,922,587 | 1.93% | (Worldbank) |
| 2007 | 7,062,672 | 1.98% | (Worldbank) |
| 2008 | 7,209,930 | 2.04% | (Worldbank) |
| 2009 | 7,364,753 | 2.1% | (Worldbank) |
| 2010 | 7,527,394 | 2.16% | (Worldbank) |
| 2011 | 7,697,510 | 2.21% | (Worldbank) |
| 2012 | 7,874,835 | 2.25% | (Worldbank) |
| 2013 | 8,059,769 | 2.29% | (Worldbank) |
| 2014 | 8,252,833 | 2.34% | (Worldbank) |
| 2015 | 8,610,000 | 4.15% | census |
| 2016 | 8,663,579 | 0.62% | (Worldbank) |
| 2017 | 8,921,343 | 2.89% | census |
| 2018 | 9,100,837 | 1.97% | (Worldbank) |
| 2019 | 9,200,000 | 1.08% | census |
| 2026 | 10,499,000 | 12.37% |
Map & Images (more maps)
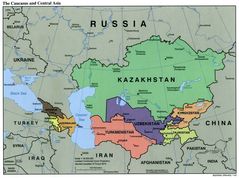
Caucasus Central Asia Political Map 2000 1
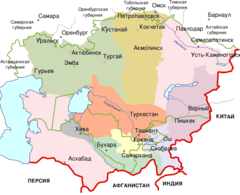
Central Asia 1900
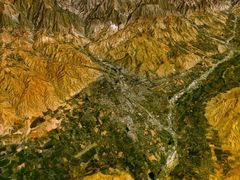
Dushambe 68 77989e 38 58624n
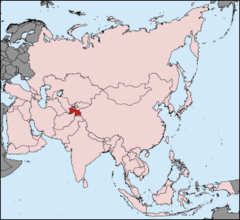
Location Map Pamir Mhn
Location Map Pamir Mhn2
Map of Pamir Demis
Pamir
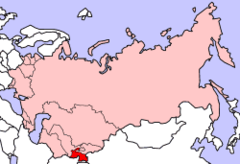
Sovietuniontajikistan
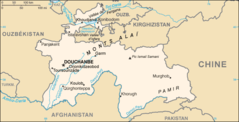
Tadjikistan Carte
Tadschikistan Pos
Tajikistan 2001 Cia Map
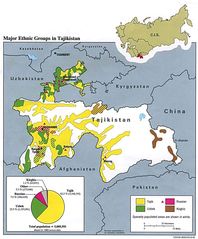
Tajikistan Ethnic 92
Tajikistan Cia Wfb Map
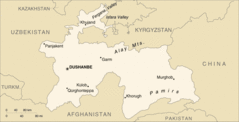
Tajikistan Map
Tajikistanstub
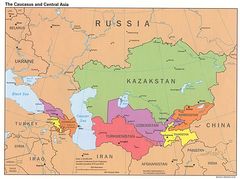
The Caucasus And Central Asia Political Map 1
Ti Map
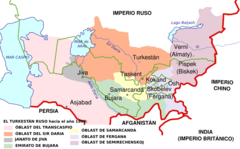
Turkestan 1900 Es
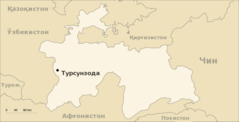
Tursunzoda In Tajikistan Tg
Un Tajikistan