Somalia, SO
Somalia: Located in the Horn of Africa, this nation is characterized by its long coastline, arid to semi-arid climate, and a predominantly pastoral economy.
About

Country Snapshot
Somalia at a glance
Somalia currently has 28 quality-checked populated place pages and 18 state or regional pages linked on MapSof.
Mapped cities & towns
28
These counts use a stricter populated-place filter so the main lists stay focused on real city and town pages.
States & regions
18
Open related pagesLargest city
MogadishuPopulation 2,587,183
Top linked places
Quick Facts about Somalia
| Population | 19,655,000 |
| Country | Somalia |
| Plate code | SO |
| Area | 637657 km2 |
| Official name | la République fédérale de Somalie, Soomaaliya, Federal Republic of Somalia |
| Continent | Africa |
| Easternmost point | Point(51.266666666 10.416666666) |
| Northernmost point | Point(50.78 11.98) |
| Latitude & Longitude | 6.0000,48.0000 |
| Legislative body | Federal Parliament of Somalia |
| Official language | Somali, Arabic |
| Capital | Mogadishu |
| Establishment | January 01, 1960 (66 years ago) |
| Time Zone | UTC+03:00 |
| Local time | 03:28:12 (2nd July 2026) |

Geography
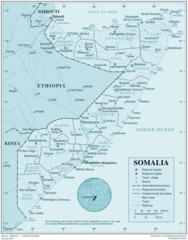
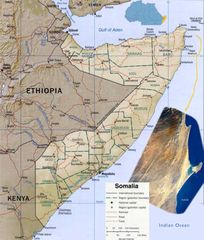
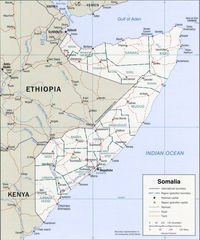
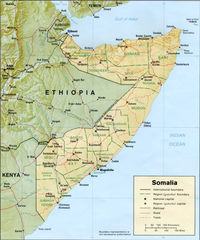
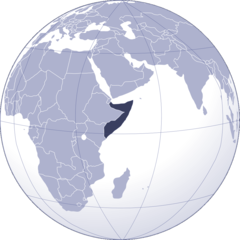
Somalia is located at 6°0'0"N 48°0'0"E (6.0000000, 48.0000000). It has 3 neighbors: Kenya, Djibouti and Ethiopia.
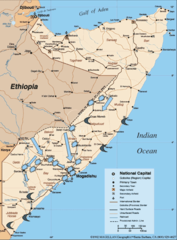
Somalia map
The largest city of Somalia is Mogadishu with a population of 2,587,183. Other cities include, Berbera population 242,344, Baidoa population 129,839, Burao population 99,270 and Bosaso population 74,287. See all Somalia cities & populated places.
Compare Somalia with
- Mudug
- Lower Shebelle
- Gedo
- Hiran
- Awdal Region
- Galguduud
- Lower Juba
- Togdheer Region
- Nugal
- Sool
- Middle Juba
- Bakool
- Bay
- Bari
- Sanaag Region
- Banaadir
- Woqooyi Galbeed
- Middle Shebelle
Demographics
| Year | Population | % Change | Method |
|---|---|---|---|
| 1960 | 2,756,380 | - | estimation process |
| 1961 | 2,814,683 | 2.07% | estimation process |
| 1962 | 2,874,944 | 2.1% | estimation process |
| 1963 | 2,937,360 | 2.12% | estimation process |
| 1964 | 3,002,173 | 2.16% | estimation process |
| 1965 | 3,069,558 | 2.2% | estimation process |
| 1966 | 3,144,244 | 2.38% | estimation process |
| 1967 | 3,227,245 | 2.57% | estimation process |
| 1968 | 3,311,111 | 2.53% | estimation process |
| 1969 | 3,385,414 | 2.19% | estimation process |
| 1970 | 3,445,420 | 1.74% | estimation process |
| 1971 | 3,477,568 | 0.92% | estimation process |
| 1972 | 3,490,295 | 0.36% | estimation process |
| 1973 | 3,526,527 | 1.03% | estimation process |
| 1974 | 3,644,572 | 3.24% | estimation process |
| 1975 | 3,880,955 | 6.09% | estimation process |
| 1976 | 4,259,636 | 8.89% | estimation process |
| 1977 | 4,754,149 | 10.4% | estimation process |
| 1978 | 5,289,049 | 10.11% | estimation process |
| 1979 | 5,758,961 | 8.16% | estimation process |
| 1980 | 6,089,707 | 5.43% | estimation process |
| 1981 | 6,251,730 | 2.59% | estimation process |
| 1982 | 6,271,538 | 0.32% | estimation process |
| 1983 | 6,199,671 | -1.16% | estimation process |
| 1984 | 6,113,252 | -1.41% | estimation process |
| 1985 | 6,068,425 | -0.74% | estimation process |
| 1986 | 6,082,723 | 0.24% | estimation process |
| 1987 | 6,138,907 | 0.92% | estimation process |
| 1988 | 6,217,331 | 1.26% | estimation process |
| 1989 | 6,285,456 | 1.08% | estimation process |
| 1990 | 6,321,615 | 0.57% | estimation process |
| 1991 | 6,319,531 | -0.03% | estimation process |
| 1992 | 6,294,017 | -0.41% | estimation process |
| 1993 | 6,269,244 | -0.4% | estimation process |
| 1994 | 6,278,911 | 0.15% | estimation process |
| 1995 | 6,346,440 | 1.06% | estimation process |
| 1996 | 6,481,035 | 2.08% | estimation process |
| 1997 | 6,673,254 | 2.88% | estimation process |
| 1998 | 6,904,978 | 3.36% | estimation process |
| 1999 | 7,149,044 | 3.41% | estimation process |
| 2000 | 7,385,416 | 3.2% | estimation process |
| 2001 | 7,609,265 | 2.94% | estimation process |
| 2002 | 7,825,924 | 2.77% | estimation process |
| 2003 | 8,037,706 | 2.63% | estimation process |
| 2004 | 8,249,965 | 2.57% | estimation process |
| 2005 | 8,466,938 | 2.56% | estimation process |
| 2006 | 8,687,671 | 2.54% | estimation process |
| 2007 | 8,910,851 | 2.5% | estimation process |
| 2008 | 9,140,259 | 2.51% | estimation process |
| 2009 | 9,380,854 | 2.56% | estimation process |
| 2010 | 9,636,173 | 2.65% | estimation process |
| 2011 | 9,907,903 | 2.74% | estimation process |
| 2012 | 10,195,134 | 2.82% | estimation process |
| 2013 | 10,495,583 | 2.86% | estimation process |
| 2014 | 13,423,576 | 21.81% | (Worldbank) |
| 2015 | 13,797,201 | 2.71% | (Worldbank) |
| 2016 | 14,185,613 | 2.74% | (Worldbank) |
| 2017 | 11,031,386 | -28.59% | estimation process |
| 2018 | 15,008,154 | 26.5% | (Worldbank) |
| 2019 | 15,442,905 | 2.82% | (Worldbank) |
| 2026 | 19,655,000 | 21.43% |
Map & Images (more maps)

Somalia Flag Map
Somalia Map
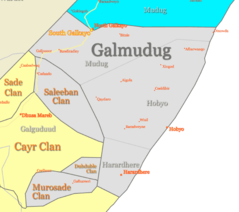
Galmudug Map
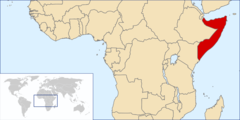
Location of Somalia
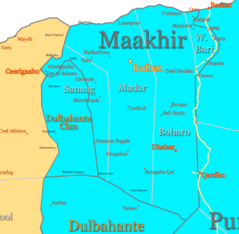
Maakhir Map
Map of Somalia
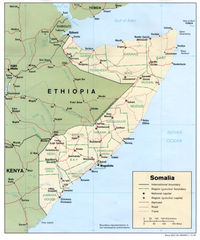
Map Somalia
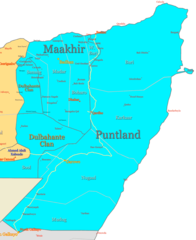
Puntland Map Regions
Somalia
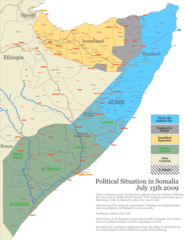
Somalia Battle 2006
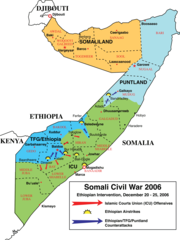
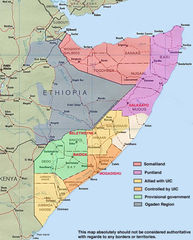
Somalia Civil War 2006
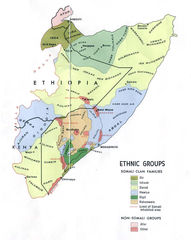
Somalia Ethnic Gorups
Somalia Map 1992
Somalia States Regions Districts
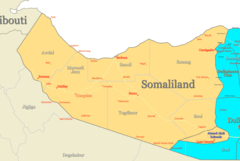
Somaliland Map Regions
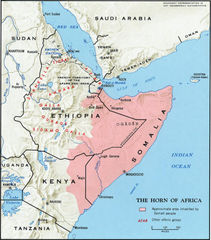
The Horn of Africa Map
Where Is Somalia Located