Saint Kitts and Nevis (Federation of Saint Kitts and Nevis), KN
Saint Kitts and Nevis: A two-island nation in the Caribbean, it is the smallest sovereign state in the Western Hemisphere.
About

Country Snapshot
Federation of Saint Kitts and Nevis at a glance
Federation of Saint Kitts and Nevis currently has 1 quality-checked populated place pages and 14 state or regional pages linked on MapSof.
Mapped cities & towns
1
These counts use a stricter populated-place filter so the main lists stay focused on real city and town pages.
States & regions
14
Open related pagesLargest city
BasseterrePopulation 12,920
Top linked places
Quick Facts about Federation of Saint Kitts and Nevis
| Population | 51,320 |
| Country | Saint Kitts and Nevis |
| Different from | San Escobar |
| Area | 269.36 km2 |
| Official name | la Fédération de Saint-Christophe-et-Niévès, Saint Kitts and Nevis |
| Continent | North America |
| Northernmost point | Point(-62.82 17.42) |
| Latitude & Longitude | 17.3333,-62.7500 |
| Legislative body | National Assembly |
| Named for | Dedication of the Basilica of Saint Mary Major |
| Official language | English |
| Capital | Basseterre |
| Establishment | February 27, 1967 (59 years ago) |
| Time Zone | UTC−04:00 |
| Local time | 07:20:05 (24th July 2026) |
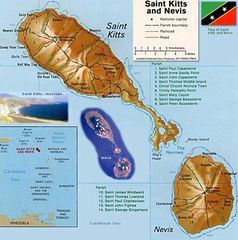
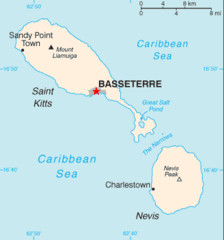
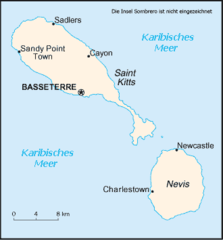
Geography
Federation of Saint Kitts and Nevis is located at 17°19'60"N 62°45'0"W (17.3333300, -62.7500000).
Saint Kitts and Nevis map
The largest city of Federation of Saint Kitts and Nevis is Basseterre with a population of 12,920. . See all Federation of Saint Kitts and Nevis cities & populated places.
Official website of Federation of Saint Kitts and Nevis
Official Website- Saint John Figtree Parish
- Saint Thomas Lowland Parish
- Christ Church Nichola Town Parish
- Saint George Basseterre Parish
- Saint George Gingerland Parish
- Saint Paul Capisterre Parish
- Saint Thomas Middle Island Parish
- Saint James Windward Parish
- Saint Peter Basseterre Parish
- Saint John Capisterre Parish
- Saint Paul Charlestown Parish
- Saint Mary Cayon Parish
- Trinity Palmetto Point Parish
- Saint Anne Sandy Point Parish
Demographics
| Year | Population | % Change | Method |
|---|---|---|---|
| 1960 | 51,197 | - | estimation process |
| 1961 | 51,195 | -0% | estimation process |
| 1962 | 50,966 | -0.45% | estimation process |
| 1963 | 50,533 | -0.86% | estimation process |
| 1964 | 49,934 | -1.2% | estimation process |
| 1965 | 49,211 | -1.47% | estimation process |
| 1966 | 48,355 | -1.77% | estimation process |
| 1967 | 47,383 | -2.05% | estimation process |
| 1968 | 46,399 | -2.12% | estimation process |
| 1969 | 45,534 | -1.9% | estimation process |
| 1970 | 44,882 | -1.45% | estimation process |
| 1971 | 44,490 | -0.88% | estimation process |
| 1972 | 44,328 | -0.37% | estimation process |
| 1973 | 44,314 | -0.03% | estimation process |
| 1974 | 44,327 | 0.03% | estimation process |
| 1975 | 44,278 | -0.11% | estimation process |
| 1976 | 44,142 | -0.31% | estimation process |
| 1977 | 43,946 | -0.45% | estimation process |
| 1978 | 43,704 | -0.55% | estimation process |
| 1979 | 43,450 | -0.58% | estimation process |
| 1980 | 43,205 | -0.57% | estimation process |
| 1981 | 42,978 | -0.53% | estimation process |
| 1982 | 42,761 | -0.51% | estimation process |
| 1983 | 42,539 | -0.52% | estimation process |
| 1984 | 42,294 | -0.58% | estimation process |
| 1985 | 42,017 | -0.66% | estimation process |
| 1986 | 41,697 | -0.77% | estimation process |
| 1987 | 41,353 | -0.83% | estimation process |
| 1988 | 41,045 | -0.75% | estimation process |
| 1989 | 40,854 | -0.47% | estimation process |
| 1990 | 40,833 | -0.05% | estimation process |
| 1991 | 41,009 | 0.43% | estimation process |
| 1992 | 41,360 | 0.85% | estimation process |
| 1993 | 41,836 | 1.14% | estimation process |
| 1994 | 42,363 | 1.24% | estimation process |
| 1995 | 42,888 | 1.22% | estimation process |
| 1996 | 43,391 | 1.16% | estimation process |
| 1997 | 43,885 | 1.13% | estimation process |
| 1998 | 44,391 | 1.14% | estimation process |
| 1999 | 44,938 | 1.22% | estimation process |
| 2000 | 45,544 | 1.33% | estimation process |
| 2001 | 46,214 | 1.45% | estimation process |
| 2002 | 46,934 | 1.53% | estimation process |
| 2003 | 47,679 | 1.56% | estimation process |
| 2004 | 48,421 | 1.53% | estimation process |
| 2005 | 49,139 | 1.46% | estimation process |
| 2006 | 49,823 | 1.37% | estimation process |
| 2007 | 50,478 | 1.3% | estimation process |
| 2008 | 51,110 | 1.24% | estimation process |
| 2009 | 51,731 | 1.2% | estimation process |
| 2010 | 52,352 | 1.19% | estimation process |
| 2011 | 52,971 | 1.17% | estimation process |
| 2012 | 53,584 | 1.14% | estimation process |
| 2013 | 54,191 | 1.12% | estimation process |
| 2014 | 50,776 | -6.73% | (Worldbank) |
| 2015 | 51,204 | 0.84% | (Worldbank) |
| 2016 | 51,629 | 0.82% | (Worldbank) |
| 2017 | 55,345 | 6.71% | estimation process |
| 2018 | 52,438 | -5.54% | (Worldbank) |
| 2019 | 52,834 | 0.75% | (Worldbank) |
| 2026 | 51,320 | -2.95% |
Map & Images (more maps)
Basseterre Map 1
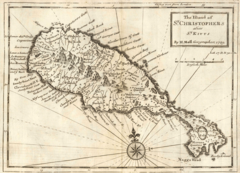
Moll the Island of St Christophers Alias St Kitts
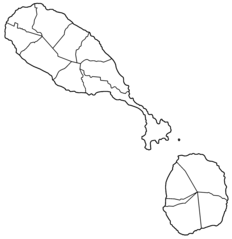
Saint Kitts And Nevis Blank
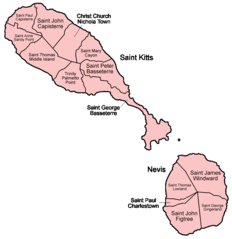
Saint Kitts And Nevis Named
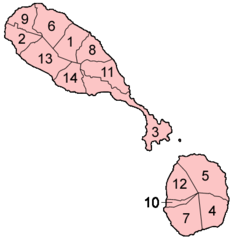
Saint Kitts And Nevis Parishes Numbered
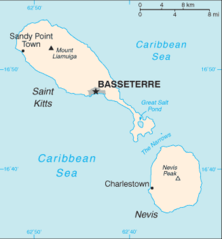
Saint Kitts And Nevis Cia Wfb Map
Saint Kitts Nevis Geohive
Sc Map
Sc Map 1
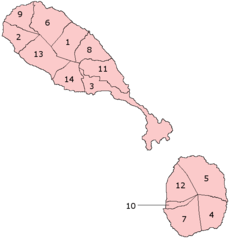
Stkitts Nevis Parishes