Palestinian Territory (Palestine), PS
Palestinian Territory: de jure sovereign state in the Middle East, recognized as such by several countries and international organizations, and as an observer member in the United Nations and for most other countries
About

Country Snapshot
Palestine at a glance
Palestine currently has 153 quality-checked populated place pages and 2 state or regional pages linked on MapSof.
Mapped cities & towns
153
These counts use a stricter populated-place filter so the main lists stay focused on real city and town pages.
States & regions
2
Open related pagesLargest city
Khān YūnisPopulation 173,183
Top linked places
Quick Facts about Palestine
| Population | 5,483,450 |
| Country | State of Palestine |
| Different from | Palistin, Palestine |
| Area | 27000 km2 |
| Official name | l’État de Palestine |
| Continent | Asia |
| Latitude & Longitude | 31.9216,35.2033 |
| Legislative body | Palestinian Legislative Council |
| Official language | Arabic |
| Capital | Jerusalem |
| Establishment | November 15, 1988 (37 years ago) |
| Time Zone | UTC+03:00, UTC+02:00 |
| Local time | 04:33:53 (21st July 2026) |

Geography
Palestine is located at 31°55'18"N 35°12'12"E (31.9215700, 35.2032900).
Palestinian Territory map
The largest city of Palestine is Khān Yūnis with a population of 173,183. Other cities include, Rafaḩ population 164,000, Hebron population 160,470, Nablus population 156,906 and Dayr al Balaḩ population 59,504. See all Palestine cities & populated places.
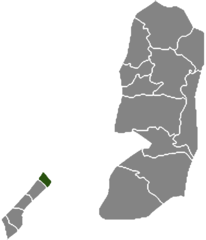
- Deir al-Balah Governorate
- Salfit Governorate
- North Gaza Governorate
- Khan Yunis Governorate
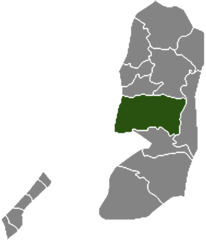
- Nablus Governorate
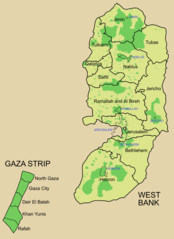
- West Bank
- Tulkarm Governorate
- Ramallah and al-Bireh Governorate
- Bethlehem Governorate
- Hebron Governorate
- Quds Governorate
- Jericho Governorate
- Jenin Governorate
- Gaza Strip
- Tubas Governorate
- Rafah Governorate
- Qalqilya Governorate
- Gaza Governorate
Demographics
| Year | Population | % Change | Method |
|---|---|---|---|
| 1990 | 1,978,248 | - | (Worldbank) |
| 1991 | 2,068,845 | 4.38% | (Worldbank) |
| 1992 | 2,163,591 | 4.38% | (Worldbank) |
| 1993 | 2,262,676 | 4.38% | (Worldbank) |
| 1994 | 2,366,298 | 4.38% | (Worldbank) |
| 1995 | 2,474,666 | 4.38% | (Worldbank) |
| 1996 | 2,587,997 | 4.38% | (Worldbank) |
| 1997 | 2,706,518 | 4.38% | (Worldbank) |
| 1998 | 2,776,568 | 2.52% | (Worldbank) |
| 1999 | 2,848,431 | 2.52% | (Worldbank) |
| 2000 | 2,922,153 | 2.52% | (Worldbank) |
| 2001 | 2,997,784 | 2.52% | (Worldbank) |
| 2002 | 3,075,373 | 2.52% | (Worldbank) |
| 2003 | 3,154,969 | 2.52% | (Worldbank) |
| 2004 | 3,236,626 | 2.52% | (Worldbank) |
| 2005 | 3,320,396 | 2.52% | (Worldbank) |
| 2006 | 3,406,334 | 2.52% | (Worldbank) |
| 2007 | 3,494,496 | 2.52% | (Worldbank) |
| 2008 | 3,591,977 | 2.71% | (Worldbank) |
| 2009 | 3,689,099 | 2.63% | (Worldbank) |
| 2010 | 3,786,161 | 2.56% | (Worldbank) |
| 2011 | 3,882,986 | 2.49% | (Worldbank) |
| 2012 | 3,979,998 | 2.44% | (Worldbank) |
| 2013 | 4,076,708 | 2.37% | (Worldbank) |
| 2014 | 4,550,368 | 10.41% | census |
| 2015 | 4,270,092 | -6.56% | (Worldbank) |
| 2016 | 4,367,088 | 2.22% | (Worldbank) |
| 2017 | 4,684,777 | 6.78% | census |
| 2018 | 4,569,087 | -2.53% | (Worldbank) |
| 2019 | 4,685,306 | 2.48% | (Worldbank) |
| 2026 | 5,483,450 | 14.56% |
Map & Images (more maps)

Palestine Flag Map
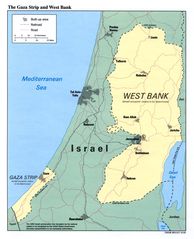
Gaza West Bank Map
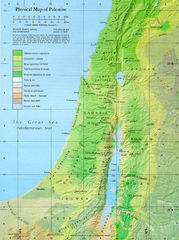
Physical Map of Palestine
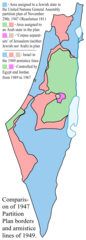
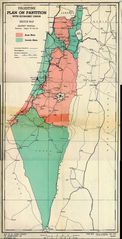
1947 Un Partition Plan
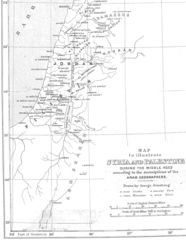
First Century Palestine
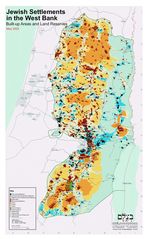
Jewish Settlements In West Bank Map
Jewish Zones 1947
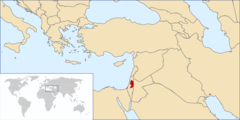
Location of Palestine
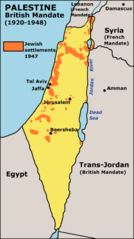
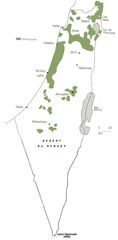
Map of Jewish Settlements In Palestine In 1947
Medieval Arab Palestine
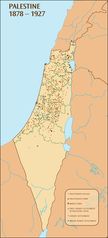
Palestine 1878 1927 Map
Palestine 1947
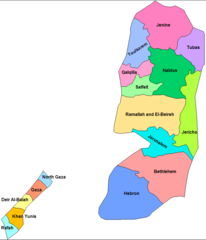
Palestine Districts
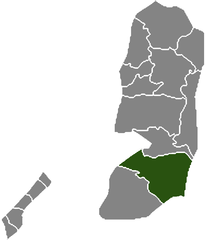
Palestine Districts Bethlehem
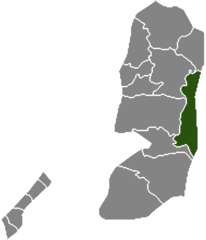
Palestine Districts Jericho
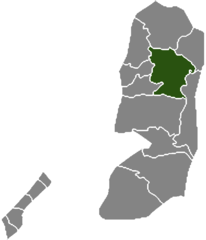
Palestine Districts Nablus
Palestine Districts North Gaza
Palestine Districts Ramallah El Beireh
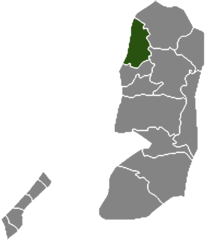
Palestine Districts Toulkarem
Palestine Election Map