New Zealand, NZ
New Zealand: Independent country in Oceania, situated on two main and around 600 smaller islands in the southwestern Pacific Ocean
About

Country Snapshot
New Zealand at a glance
New Zealand currently has 117 quality-checked populated place pages and 13 state or regional pages linked on MapSof.
Mapped cities & towns
117
These counts use a stricter populated-place filter so the main lists stay focused on real city and town pages.
States & regions
13
Open related pagesLargest city
WellingtonPopulation 418,500
Top linked places
Quick Facts about New Zealand
| Population | 5,324,700 |
| Country | New Zealand |
| Plate code | NZ |
| Area | 268021 km2 |
| Official name | New Zealand, Nouvelle-Zélande |
| Has part | Waiheke Island |
| Continent | Oceania |
| Easternmost point | Point(178.55051479 -37.69226391) |
| Northernmost point | Point(-172.52 -8.53) |
| Latitude & Longitude | -42.0000,174.0000 |
| Legislative body | New Zealand Parliament |
| Named for | Zeeland |
| Official language | English, Māori, New Zealand Sign Language |
| Capital | Okiato, Wellington, Auckland |
| Time Zone | UTC+13:00, UTC+13:45, UTC+12:00, UTC−11:00, UTC−10:00, UTC+12:45 |
| Local time | 01:50:21 (19th July 2026) |

Geography
New Zealand is located at 42°0'0"S 174°0'0"E (-42.0, 174.0).
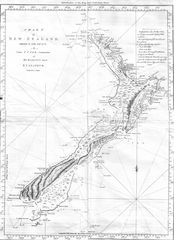
New Zealand map
The largest city of New Zealand is Wellington with a population of 418,500. Other cities include, Auckland population 417,910, Tauranga population 135,000, Dunedin population 114,347 and Lower Hutt population 102,700. See all New Zealand cities & populated places.
- Marlborough District
- Gisborne District
- Canterbury Region
- Nelson Region
- Manawatū-Whanganui Region
- Taranaki Region
- Auckland Region
- Hawke's Bay Region
- West Coast Region
- Waikato Region
- Bay of Plenty Region
- Southland Region
- Tasman District
- Wellington Region
- Northland Region
- Chatham Islands Council
- Otago Region
Demographics
| Year | Population | % Change | Method |
|---|---|---|---|
| 1960 | 2,371,800 | - | (Worldbank) |
| 1961 | 2,419,700 | 1.98% | (Worldbank) |
| 1962 | 2,482,000 | 2.51% | (Worldbank) |
| 1963 | 2,531,800 | 1.97% | (Worldbank) |
| 1964 | 2,585,400 | 2.07% | (Worldbank) |
| 1965 | 2,628,400 | 1.64% | (Worldbank) |
| 1966 | 2,675,900 | 1.78% | (Worldbank) |
| 1967 | 2,724,100 | 1.77% | (Worldbank) |
| 1968 | 2,748,100 | 0.87% | (Worldbank) |
| 1969 | 2,772,800 | 0.89% | (Worldbank) |
| 1970 | 2,810,700 | 1.35% | (Worldbank) |
| 1971 | 2,853,000 | 1.48% | (Worldbank) |
| 1972 | 2,903,900 | 1.75% | (Worldbank) |
| 1973 | 2,961,300 | 1.94% | (Worldbank) |
| 1974 | 3,023,700 | 2.06% | (Worldbank) |
| 1975 | 3,083,100 | 1.93% | (Worldbank) |
| 1976 | 3,110,500 | 0.88% | (Worldbank) |
| 1977 | 3,120,200 | 0.31% | (Worldbank) |
| 1978 | 3,121,200 | 0.03% | (Worldbank) |
| 1979 | 3,109,000 | -0.39% | (Worldbank) |
| 1980 | 3,112,900 | 0.13% | (Worldbank) |
| 1981 | 3,124,900 | 0.38% | (Worldbank) |
| 1982 | 3,156,100 | 0.99% | (Worldbank) |
| 1983 | 3,199,300 | 1.35% | (Worldbank) |
| 1984 | 3,227,100 | 0.86% | (Worldbank) |
| 1985 | 3,247,100 | 0.62% | (Worldbank) |
| 1986 | 3,246,300 | -0.02% | (Worldbank) |
| 1987 | 3,274,400 | 0.86% | (Worldbank) |
| 1988 | 3,283,400 | 0.27% | (Worldbank) |
| 1989 | 3,299,200 | 0.48% | (Worldbank) |
| 1990 | 3,329,800 | 0.92% | (Worldbank) |
| 1991 | 3,495,100 | 4.73% | (Worldbank) |
| 1992 | 3,531,700 | 1.04% | (Worldbank) |
| 1993 | 3,572,200 | 1.13% | (Worldbank) |
| 1994 | 3,620,000 | 1.32% | (Worldbank) |
| 1995 | 3,673,400 | 1.45% | (Worldbank) |
| 1996 | 3,732,000 | 1.57% | (Worldbank) |
| 1997 | 3,781,300 | 1.3% | (Worldbank) |
| 1998 | 3,815,000 | 0.88% | (Worldbank) |
| 1999 | 3,835,100 | 0.52% | (Worldbank) |
| 2000 | 3,857,700 | 0.59% | (Worldbank) |
| 2001 | 3,880,500 | 0.59% | (Worldbank) |
| 2002 | 3,948,500 | 1.72% | (Worldbank) |
| 2003 | 4,000,000 | 1.29% | estimation process |
| 2004 | 4,087,500 | 2.14% | (Worldbank) |
| 2005 | 4,133,900 | 1.12% | (Worldbank) |
| 2006 | 4,184,600 | 1.21% | (Worldbank) |
| 2007 | 4,223,800 | 0.93% | (Worldbank) |
| 2008 | 4,259,800 | 0.85% | (Worldbank) |
| 2009 | 4,302,600 | 0.99% | (Worldbank) |
| 2010 | 4,350,700 | 1.11% | (Worldbank) |
| 2011 | 4,384,000 | 0.76% | (Worldbank) |
| 2012 | 4,408,100 | 0.55% | (Worldbank) |
| 2013 | 4,442,100 | 0.77% | estimation process |
| 2014 | 4,509,700 | 1.5% | estimation process |
| 2015 | 4,595,700 | 1.87% | estimation process |
| 2016 | 4,693,200 | 2.08% | estimation process |
| 2017 | 4,793,700 | 2.1% | estimation process |
| 2018 | 4,885,300 | 1.88% | estimation process |
| 2019 | 4,942,500 | 1.16% | estimation process |
| 2026 | 5,324,700 | 7.18% |
Map & Images (more maps)
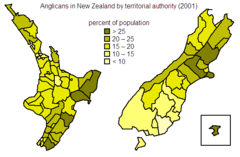
Anglicans In Nz
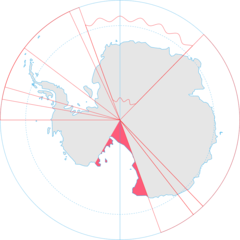
Antarctica, New Zealand Territorial Claim
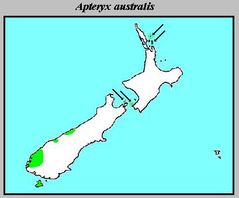
Apteryx Australis Distribution
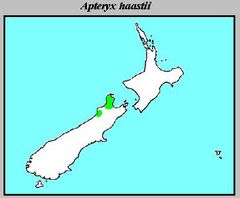
Apteryx Haastii Distribution
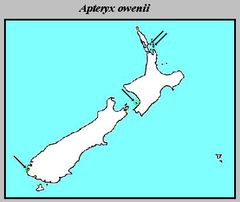
Apteryx Owenii Distribution
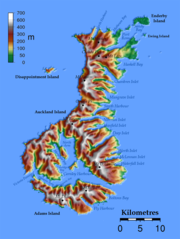
Auckland Islands Topo
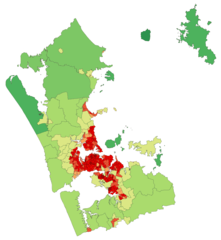
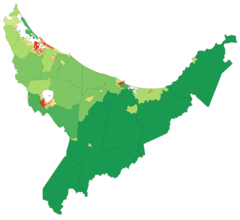
Aucklandregionpopulationdensity
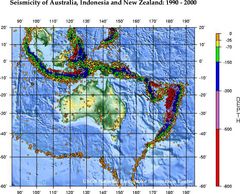
Ausseis 1
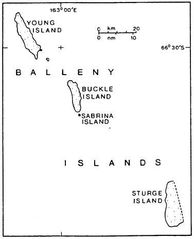
Balleny Map
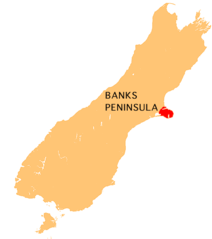
Banks Peninsula Map
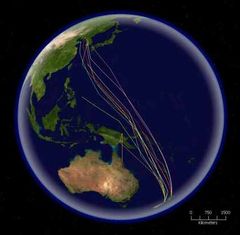
Bar Tailed Godwit Migration 1
Bayofplentyregionpopulationdensity
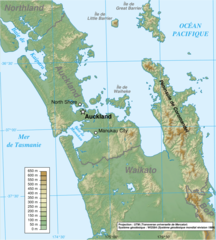
Carte Auckland Region Fr
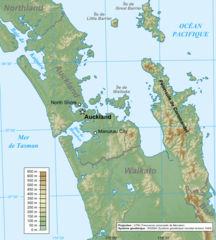
Carte Auckland Region
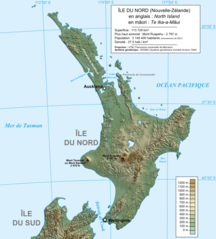
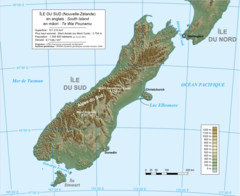
Carte Ile Du Nord Nz
Carte Ile Du Sud Nz
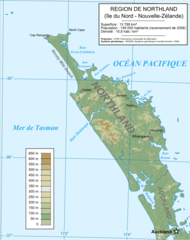
Carte Physique Northland
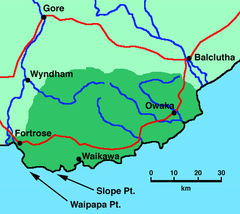
Catlinsmap
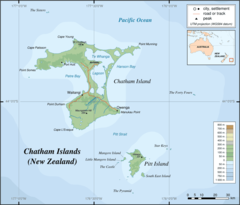
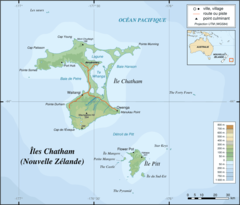
Chatham Islands Map Topo En
Chatham Islands Map Topo Fr