New Paris, Pennsylvania
New Paris: borough of Pennsylvania
About
New Paris is a city located in the county of Bedford in the U.S. state of Pennsylvania. Its population at the 2010 census was 186 and a population density of 3,100 people per km². After 10 years in 2020 city had an estimated population of 172 inhabitants.
The city was created 180 years ago in 1845.
Quick Facts about New Paris
| Population | 172 (2020) |
| Country | United States of America |
| State | Pennsylvania (United States) |
| County | Bedford County |
| Area | 0.06 km2 |
| Latitude & Longitude | 40.1065,-78.6447 |
| Altitude | 5,413 feet / 1650 meters |
| Establishment | January 01, 1846 (180 years ago) |
| Time Zone | America/New_York |
| Local time | 11:24:53 (17th July 2026) |
| Postal code | 15554 |
| Density | 2,867 Pop. per km² as of 2020 |
| Population growth | -8.14% (2010-2020) |
| Weather | 85℉ Smoke 7-days weather |
Geography
New Paris is located at 40°6'23"N 78°38'41"W (40.1064700, -78.6447400).
New Paris map
Weather
Smoke. Partly sunny, with a high near 85. Northwest wind around 2 mph.
7-Day ForecastDemographics
According to census records, the population of New Paris decreased by 8.14% in 10 years.
| Year | Population | % Change | Method |
|---|---|---|---|
| 2010 | 186 | - | census |
| 2011 | 181 | -2.76% | estimation process |
| 2012 | 181 | 0% | estimation process |
| 2013 | 179 | -1.12% | estimation process |
| 2014 | 178 | -0.56% | estimation process |
| 2015 | 177 | -0.56% | estimation process |
| 2016 | 176 | -0.57% | estimation process |
| 2017 | 173 | -1.73% | estimation process |
| 2018 | 173 | 0% | estimation process |
| 2019 | 172 | -0.58% | estimation process |
| 2020 | 172 | 0% | estimation process |
Demographic Facts
| Estimated population as of July 1, 2019 : | 38,885 |
| Based on demographic estimates as of April 1, 2010 : | 40,101 |
| Based on demographic estimates as of 1 April 2010 : | -3.0% |
| April 1, 2020 Population : | 38,714 |
| April 1, 2010 Population : | 40,097 |
| People under 5 years old, percentage : | 5.5% |
| People under 18 years old, percentage : | 22.3% |
| People over 65 (%) : | 18.5% |
| Female persons, % : | 50.1% |
| White only, percent : | 94.6% |
| Black or African American alone, percent : | 2.1% |
| American Indian and Alaska Native only, % : | 0.4% |
| Asians alone % : | 0.5% |
| Only Native Hawaiians and Other Pacific Islanders, % : | Z |
| % of people who have participated in two or more races : | 2.3% |
| % of Hispanic or Latino : | 1.7% |
| White people, not Hispanic or Latino people, make up the majority of the population. : | 93.2% |
| 2015-2019 Veterans : | 2,706 |
| Percentage of foreign-born people, 2015-2019 : | 1.0% |
| Residential units, July 1, 2019 : | 16,848 |
Economic Facts
| Residential units, July 1, 2019 : | 16,848 |
| Rate of owner-occupied housing units, 2015-2019 : | 73.2% |
| Owner-occupied housing unit median value, 2015-2019 : | $132,800 |
| From 2015 to 2019, the median selected monthly owner costs - with a mortgage : | $1,156 |
| Monthly owner costs, without a mortgage, at the median, 2015-2019 : | $458 |
| 2015-2019 median gross rent : | $696 |
| Permits for construction, 2020 : | 52 |
| 2015-2019 Households : | 15,159 |
| Population per household, 2015-2019 : | 2.51 |
| Living in the same house a year ago, percentage of people aged one year and up, 2015-2019 : | 84.7% |
| Languages other than English spoken at home, as a percentage of people aged 5 and up, 2015-2019 : | 1.5% |
| Households with computers, %, 2015-2019 : | 90.6% |
| Percentage of households with a broadband Internet subscription, 2015-2019 : | 83.6% |
| Percentage of people aged 25 and up with a high school diploma or higher, 2015-2019 : | 91.2% |
| Bachelor's degree or higher, proportion of people aged 25 and up, 2015-2019 : | 16.1% |
| Percentage of people under the age of 65 who have a disability, 2015-2019 : | 12.0% |
| Persons under the age of 65 who do not have health insurance, as a percentage : | 6.8% |
| Total civilian labor force, percent of population aged 16 and up, 2015-2019 : | 61.9% |
| Female labor force participation in the civilian labor force, as a percentage of the population aged 16 and up, 2015-2019 : | 56.6% |
| Total sales of lodging and food services in 2012 ($1,000) : | 29,916 |
| Total receipts/revenue for health care and social assistance in 2012 ($1,000) : | 89,115 |
| Manufacturers' total shipments in 2012 ($1,000) : | 1,387,046 |
| 2012 total retail sales ($1,000) : | 271,252 |
| 2012 total retail sales per capita : | $6,856 |
| Mean commute time to work (in minutes), workers aged 16 and up, 2015-2019 : | 25.3 |
| 2015-2019 median household income (in 2019 dollars) : | $60,112 |
| Income per capita in the previous 12 months (in 2019 dollars), 2015-2019 : | $27,722 |
| Percentage of people living in poverty : | 7.7% |
| Total number of employer establishments, 2019 : | 584 |
| 2019 total employment : | 9,594 |
| 2019 total annual payroll ($1,000) : | 416,812 |
| Total employment, change in percentage terms, 2018-2019 : | -3.8% |
| 2018 total non-employer establishments : | 2,344 |
| Total number of businesses in 2012 : | 3,276 |
| Men-owned businesses in 2012 : | 1,818 |
| Women-owned businesses in 2012 : | 1,078 |
| Minority-owned businesses in 2012 : | 92 |
| Non-minority-owned businesses in 2012 : | 3,088 |
| Veteran-owned businesses in 2012 : | 272 |
| Nonveteran-owned businesses in 2012 : | 2,898 |
| 2010 population per square mile : | 93.5 |
| 2010 land area in square miles : | 428.67 |
Best Things to Do in New Paris
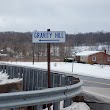
1Gravity Hill
New Paris, PA 15554, United States View details
Phone: +18007653331 | Website available
Nearby Schools and Colleges
Schools and campuses linked to New Paris, PA. Select a name to open its map and contact details.
| Code | Name | City | ZIP |
|---|---|---|---|
| 215284 | University of Pittsburgh-Johnstown | Johnstown (PA) | 15904 |
Nearby Transit Stations (16)
Rail and bus stations connected to New Paris, PA. Select a station to open its map and address details.
| Code | Name | Address | Type |
|---|---|---|---|
| JST | Johnstown | 47 Walnut Street | RAIL |
| ALT | Altoona Transportation Center | 1231 11th Avenue | RAIL |
| CUA | Cumberland, MD | 12401 Willowbrook Road SE | BUS |
| Code: C U M | Cumberland station | East Harrison and Queen City Street | RAIL |
| FSB | Frostburg, MD | 101 Braddock Road | BUS |
Closest post offices linked to New Paris.
| Post Office Name | City | ZIP |
|---|---|---|
| New Par Post Office | New Paris (PA) | 15554 |
Other places with the same name (1)
- New Paris, Ohio city in Preble County, Ohio, United States of America with a population of 1,570 people.
Other cities in Bedford County
Cities, towns, neighborhoods & other populated places in Bedford County , PA. (more)
| City Name | Population | Title |
|---|---|---|
| Point | 3,582 | Township in northern Northumberland County, Pennsylvania |
| Centerville | 3,133 | Human settlement in Washington County, Pennsylvania, United States of America |
| Bedford | 2,667 | Town in Bedford County, Virginia, United States |
| Marysville | 2,553 | Borough in southeastern Perry County, Pennsylvania |
| Napier | 2,109 | Township of Pennsylvania |
| Hartley | 1,805 | Township in western Union County, Pennsylvania |
| Everett | 1,717 | Borough of Pennsylvania, USA |
| King | 1,181 | Township in Bedford County, Pennsylvania |
| Palo Alto | 975 | Borough in central Schuylkill County, Pennsylvania |
| Hyndman | 854 | Borough of Pennsylvania |
| Saxton | 679 | Borough in Bedford County, Pennsylvania |
| Finleyville | 392 | Borough of Pennsylvania |
| Schellsburg | 317 | Borough of Pennsylvania |
| Manns Choice | 283 | Borough of Pennsylvania |
| Pavia | 273 | Township in Bedford County, Pennsylvania |
| Woodbury | 265 | Borough of Pennsylvania |