Mokena, Illinois
Mokena: city in Illinois, United States of America
About
Mokena is a city located in the county of Will in the U.S. state of Illinois. Its population at the 2010 census was 18,740 and a population density of 2,108 people per km². After 10 years in 2020 city had an estimated population of 20,050 inhabitants.
The city was created 146 years ago in 1879.

Quick Facts about Mokena
| Population | 20,050 (2020) |
| Country | United States of America |
| State | Illinois (United States) |
| County | Will County |
| Area | 8.89 km2 |
| Latitude & Longitude | 41.5261,-87.8892 |
| Altitude | 705 feet / 215 meters |
| Establishment | January 01, 1880 (146 years ago) |
| Time Zone | America/Chicago |
| Local time | 12:00:31 (3rd August 2026) |
| Postal code | 60448 |
| Density | 2,255 Pop. per km² as of 2020 |
| Population growth | 6.53% (2010-2020) |
| Weather | 61℉ Partly Cloudy then Patchy Fog 7-days weather |
Geography
Mokena is located at 41°31'34"N 87°53'21"W (41.5261400, -87.8892200).
Mokena map
Weather
Patchy fog after 2am. Partly cloudy, with a low around 61. North northeast wind 5 to 10 mph, with gusts as high as 20 mph.
7-Day ForecastOfficial website of Mokena
Official WebsiteDemographics
The population of Mokena increased by 6.53% in 10 years.
| Year | Population | % Change | Method |
|---|---|---|---|
| 2010 | 18,740 | - | census |
| 2011 | 18,812 | 0.38% | estimation process |
| 2012 | 18,932 | 0.63% | estimation process |
| 2013 | 19,066 | 0.7% | estimation process |
| 2014 | 19,315 | 1.29% | estimation process |
| 2015 | 19,762 | 2.26% | estimation process |
| 2016 | 19,929 | 0.84% | estimation process |
| 2017 | 20,074 | 0.72% | estimation process |
| 2018 | 20,172 | 0.49% | estimation process |
| 2019 | 20,159 | -0.06% | estimation process |
| 2020 | 20,050 | -0.54% | estimation process |
Demographic Facts
| Estimated population as of July 1, 2019 : | 8,058 |
| Based on demographic estimates as of April 1, 2010 : | 8,060 |
| Based on demographic estimates as of 1 April 2010 : | 0.0% |
| April 1, 2020 Population : | 8,280 |
| April 1, 2010 Population : | 8,067 |
| People under 5 years old, percentage : | 4.8% |
| People under 18 years old, percentage : | 23.3% |
| People over 65 (%) : | 25.2% |
| Female persons, % : | 50.8% |
| White only, percent : | 61.4% |
| Black or African American alone, percent : | 2.0% |
| American Indian and Alaska Native only, % : | 0.1% |
| Asians alone % : | 28.9% |
| Only Native Hawaiians and Other Pacific Islanders, % : | 0.0% |
| % of people who have participated in two or more races : | 4.6% |
| % of Hispanic or Latino : | 10.2% |
| White people, not Hispanic or Latino people, make up the majority of the population. : | 54.8% |
| 2015-2019 Veterans : | 279 |
| Percentage of foreign-born people, 2015-2019 : | 25.8% |
| Rate of owner-occupied housing units, 2015-2019 : | 92.5% |
Economic Facts
| Rate of owner-occupied housing units, 2015-2019 : | 92.5% |
| Owner-occupied housing unit median value, 2015-2019 : | $1,326,600 |
| From 2015 to 2019, the median selected monthly owner costs - with a mortgage : | $4,000+ |
| Monthly owner costs, without a mortgage, at the median, 2015-2019 : | $1,005 |
| 2015-2019 median gross rent : | $3,353 |
| 2015-2019 Households : | 2,920 |
| Population per household, 2015-2019 : | 2.80 |
| Living in the same house a year ago, percentage of people aged one year and up, 2015-2019 : | 89.9% |
| Languages other than English spoken at home, as a percentage of people aged 5 and up, 2015-2019 : | 31.5% |
| Households with computers, %, 2015-2019 : | 96.7% |
| Percentage of households with a broadband Internet subscription, 2015-2019 : | 93.7% |
| Percentage of people aged 25 and up with a high school diploma or higher, 2015-2019 : | 99.3% |
| Bachelor's degree or higher, proportion of people aged 25 and up, 2015-2019 : | 67.2% |
| Percentage of people under the age of 65 who have a disability, 2015-2019 : | 4.8% |
| Persons under the age of 65 who do not have health insurance, as a percentage : | 4.1% |
| Total civilian labor force, percent of population aged 16 and up, 2015-2019 : | 54.8% |
| Female labor force participation in the civilian labor force, as a percentage of the population aged 16 and up, 2015-2019 : | 44.3% |
| Total sales of lodging and food services in 2012 ($1,000) : | 26,219 |
| Total receipts/revenue for health care and social assistance in 2012 ($1,000) : | 40,708 |
| 2012 total retail sales ($1,000) : | 148,843 |
| 2012 total retail sales per capita : | $18,174 |
| Mean commute time to work (in minutes), workers aged 16 and up, 2015-2019 : | 33.1 |
| 2015-2019 median household income (in 2019 dollars) : | $150,135 |
| Income per capita in the previous 12 months (in 2019 dollars), 2015-2019 : | $75,038 |
| Percentage of people living in poverty : | 3.3% |
| Total number of businesses in 2012 : | 1,727 |
| Men-owned businesses in 2012 : | 889 |
| Women-owned businesses in 2012 : | 643 |
| Minority-owned businesses in 2012 : | 468 |
| Non-minority-owned businesses in 2012 : | 1,174 |
| Veteran-owned businesses in 2012 : | 233 |
| Nonveteran-owned businesses in 2012 : | 1,352 |
| 2010 population per square mile : | 2,260.1 |
| 2010 land area in square miles : | 3.57 |
| Rate of owner-occupied housing units, 2015-2019 : | 90.6% |
| Owner-occupied housing unit median value, 2015-2019 : | $277,500 |
| From 2015 to 2019, the median selected monthly owner costs - with a mortgage : | $2,251 |
| Monthly owner costs, without a mortgage, at the median, 2015-2019 : | $830 |
| 2015-2019 median gross rent : | $1,410 |
| 2015-2019 Households : | 2,151 |
| Population per household, 2015-2019 : | 2.97 |
| Living in the same house a year ago, percentage of people aged one year and up, 2015-2019 : | 92.0% |
| Languages other than English spoken at home, as a percentage of people aged 5 and up, 2015-2019 : | 3.3% |
| Households with computers, %, 2015-2019 : | 99.7% |
| Percentage of households with a broadband Internet subscription, 2015-2019 : | 98.9% |
| Percentage of people aged 25 and up with a high school diploma or higher, 2015-2019 : | 96.5% |
| Bachelor's degree or higher, proportion of people aged 25 and up, 2015-2019 : | 33.4% |
| Percentage of people under the age of 65 who have a disability, 2015-2019 : | 5.8% |
| Persons under the age of 65 who do not have health insurance, as a percentage : | 3.6% |
| Total civilian labor force, percent of population aged 16 and up, 2015-2019 : | 69.3% |
| Female labor force participation in the civilian labor force, as a percentage of the population aged 16 and up, 2015-2019 : | 67.9% |
| 2012 total retail sales ($1,000) : | 119,861 |
| 2012 total retail sales per capita : | $18,926 |
| Mean commute time to work (in minutes), workers aged 16 and up, 2015-2019 : | 33.0 |
| 2015-2019 median household income (in 2019 dollars) : | $117,684 |
| Income per capita in the previous 12 months (in 2019 dollars), 2015-2019 : | $43,291 |
| Percentage of people living in poverty : | 6.1% |
| Total number of businesses in 2012 : | 641 |
| Men-owned businesses in 2012 : | 391 |
| Women-owned businesses in 2012 : | 158 |
| Minority-owned businesses in 2012 : | F |
| Non-minority-owned businesses in 2012 : | 615 |
| Veteran-owned businesses in 2012 : | 31 |
| Nonveteran-owned businesses in 2012 : | 593 |
| 2010 population per square mile : | 895.2 |
| 2010 land area in square miles : | 7.08 |
| Rate of owner-occupied housing units, 2015-2019 : | 69.3% |
| Owner-occupied housing unit median value, 2015-2019 : | $259,900 |
| From 2015 to 2019, the median selected monthly owner costs - with a mortgage : | $2,380 |
| Monthly owner costs, without a mortgage, at the median, 2015-2019 : | $1,094 |
| 2015-2019 median gross rent : | $1,162 |
| 2015-2019 Households : | 3,064 |
| Population per household, 2015-2019 : | 2.83 |
| Living in the same house a year ago, percentage of people aged one year and up, 2015-2019 : | 87.9% |
| Languages other than English spoken at home, as a percentage of people aged 5 and up, 2015-2019 : | 13.8% |
| Households with computers, %, 2015-2019 : | 97.5% |
| Percentage of households with a broadband Internet subscription, 2015-2019 : | 91.9% |
| Percentage of people aged 25 and up with a high school diploma or higher, 2015-2019 : | 97.5% |
| Bachelor's degree or higher, proportion of people aged 25 and up, 2015-2019 : | 47.0% |
| Percentage of people under the age of 65 who have a disability, 2015-2019 : | 4.6% |
| Persons under the age of 65 who do not have health insurance, as a percentage : | 4.2% |
| Total civilian labor force, percent of population aged 16 and up, 2015-2019 : | 71.5% |
| Female labor force participation in the civilian labor force, as a percentage of the population aged 16 and up, 2015-2019 : | 64.3% |
| Total sales of lodging and food services in 2012 ($1,000) : | 13,781 |
| Manufacturers' total shipments in 2012 ($1,000) : | 82,224 |
| 2012 total retail sales ($1,000) : | 56,437 |
| 2012 total retail sales per capita : | $6,422 |
| Mean commute time to work (in minutes), workers aged 16 and up, 2015-2019 : | 35.4 |
| 2015-2019 median household income (in 2019 dollars) : | $105,341 |
| Income per capita in the previous 12 months (in 2019 dollars), 2015-2019 : | $43,349 |
| Percentage of people living in poverty : | 2.8% |
| Total number of businesses in 2012 : | 679 |
| Men-owned businesses in 2012 : | 351 |
| Women-owned businesses in 2012 : | 217 |
| Minority-owned businesses in 2012 : | 117 |
| Non-minority-owned businesses in 2012 : | 545 |
| Veteran-owned businesses in 2012 : | F |
| Nonveteran-owned businesses in 2012 : | 640 |
| 2010 population per square mile : | 1,413.0 |
| 2010 land area in square miles : | 6.19 |
Best Things to Do in Mokena
1Urban Air Trampoline and Adventure Park
19800 South La Grange Road, Mokena, IL 60448, United States View details
Phone: +13125289405 | Website available

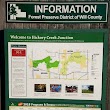
2Hickory Creek Preserve
20400 Wolf Rd, Mokena, IL 60448, United States View details
Phone: +18157278700 | Website available
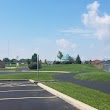
3Mokena Community Park District
10925 W La Porte Rd, Mokena, IL 60448, United States View details
Phone: +17083902401 | Website available

4Hecht Park
9310 Birch Ave, Mokena, IL 60448, United States View details
Website available
5Hickory Creek Preserve - Hickory Creek Junction
21063 Prestancia Dr, Mokena, IL 60448, United States View details
Phone: +18157278700 | Website available

Where to Eat in Mokena
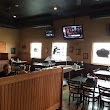
1Accelerate Indoor Speedway & Events - Chicago
8580 Springlake Dr, Mokena, IL 60448, United States View details
Phone: +17084577772 | Website available

2Denny's
19099 Old Lagrange Rd, Mokena, IL 60448, United States View details
Phone: +17084796488 | Website available

3Popeyes Louisiana Kitchen
19814 South La Grange Road, Mokena, IL 60448, United States View details
Phone: +17089951858 | Website available

4Beggars Pizza
9515 W 191st St, Mokena, IL 60448, United States View details
Phone: +17084797600 | Website available
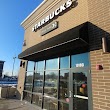
5Starbucks
19180 South La Grange Road, Mokena, IL 60448, United States View details
Phone: +13127647446 | Website available
Where to Stay in Mokena
1Super 8 by Wyndham Mokena/Frankfort /I-80
9485 W 191st St, Mokena, IL 60448, United States View details
Phone: +17083909009 | Website available

People born in Mokena (7)
People born in Mokena, including composer Wilbur Hatch, soccer player Andrew Duran, actress and singer Karla DeVito, .
More notable people
- Jason Guida (American martial artist) he was born in 04/08/1977
- Dean Anna (Major League Baseball infielder in the New York Yankees organization) he was born in 24/11/1986
- Bob Strait (American stock car racing driver) he was born in 12/04/1949
- Ken Knapczyk (American-football player (1963-)) he was born in 21/04/1963
Nearby Schools and Colleges
Schools and campuses linked to Mokena, IL. Select a name to open its map and contact details.
| Code | Name | City | ZIP |
|---|---|---|---|
| 457031 | Capri Beauty College | New Lenox (IL) | 60451 |
Nearby Transit Stations (20)
Rail and bus stations connected to Mokena, IL. Select a station to open its map and address details.
| Code | Name | Address | Type |
|---|---|---|---|
| JOL | Joliet Transportation Center | 50 East Jefferson Street | RAIL |
| HMW | Homewood | 18015 Park Ave. | RAIL |
| SMT | Summit | Archer Ave. and South Center Ave. | RAIL |
| DYE | Dyer station | 913 Sheffield Avenue | RAIL |
| LAG | La Grange Road | 25 West Burlington St. | RAIL |
Closest post offices linked to Mokena.
| Post Office Name | City | ZIP |
|---|---|---|
| Mokena Post Office | Mokena (IL) | 60448 |
Other cities in Will County
Cities, towns, neighborhoods & other populated places in Will County , IL. (more)
| City Name | Population | Title |
|---|---|---|
| Joliet | 85,583 | The second most populous city in Will County, Illinois. |
| Bolingbrook | 74,025 | Town in Illinois |
| Lockport | 59,877 | The most populous city in Will County, Illinois. |
| Romeoville | 39,770 | Town |
| New Lenox | 27,088 | Village in Illinois |
| Homer Glen | 24,281 | Village in Illinois, United States |
| Crest Hill | 21,153 | City in Will County, Illinois, United States |
| Goodings Grove | 18,569 | City in Illinois, United States of America |
| Shorewood | 17,495 | Village in Illinois |
| Channahon | 13,409 | City in Illinois, United States of America |
| Frankfort Square | 9,276 | Census-designated place in Will County, Illinois, United States |
| Manhattan | 8,798 | Village in Illinois |
| Crete | 8,493 | Town in the U. |
| Braidwood | 6,148 | City in Will County, Illinois, United States |
| Wilmington | 5,597 | Town in Will County, Illinois, United States |
| Monee | 5,029 | City in Illinois, United States of America |
Distance to Other Cities
Mokena distances to largest Illinois cities