Crete, Illinois
Crete: town in the U.
About
Crete is a town located in the county of Will in the U.S. state of Illinois. Its population at the 2010 census was 8,259 and a population density of 854 people per km². After 10 years in 2020 city had an estimated population of 8,493 inhabitants.
The town was created 190 years ago in 1835.

Quick Facts about Crete
| Population | 8,493 (2020) |
| Country | United States of America |
| State | Illinois (United States) |
| County | Will County |
| Postal code | 60417 |
| Plate code | 708 |
| Phone Area Codes | 708 |
| Area | 9.67 km2 |
| Latitude & Longitude | 41.4445,-87.6314 |
| Establishment | January 01, 1836 (190 years ago) |
| Time Zone | America/Chicago |
| Local time | 03:59:44 (15th July 2026) |
| Density | 878 Pop. per km² as of 2020 |
| Population growth | 2.76% (2010-2020) |
| Weather | 93℉ Sunny 7-days weather |
Geography
Crete is located at 41°26'40"N 87°37'53"W (41.4444800, -87.6314300).
Crete map
Weather
Sunny, with a high near 93. Heat index values as high as 101. West wind 5 to 10 mph.
7-Day ForecastOfficial website of Crete
Official WebsiteDemographics
The population of Crete increased by 2.76% in 10 years.
| Year | Population | % Change | Method |
|---|---|---|---|
| 2010 | 8,259 | - | census |
| 2011 | 8,267 | 0.1% | estimation process |
| 2012 | 8,263 | -0.05% | estimation process |
| 2013 | 8,233 | -0.36% | estimation process |
| 2014 | 8,209 | -0.29% | estimation process |
| 2015 | 8,178 | -0.38% | estimation process |
| 2016 | 8,164 | -0.17% | estimation process |
| 2017 | 8,124 | -0.49% | estimation process |
| 2018 | 8,081 | -0.53% | estimation process |
| 2019 | 8,023 | -0.72% | estimation process |
| 2020 | 8,493 | 5.53% | estimation process |
Demographic Facts
| Estimated population as of July 1, 2019 : | 7,565 |
| Based on demographic estimates as of April 1, 2010 : | 6,649 |
| Based on demographic estimates as of 1 April 2010 : | 13.8% |
| April 1, 2020 Population : | 7,481 |
| April 1, 2010 Population : | 6,640 |
| People under 5 years old, percentage : | 7.8% |
| People under 18 years old, percentage : | 30.5% |
| People over 65 (%) : | 13.0% |
| Female persons, % : | 53.7% |
| White only, percent : | 84.9% |
| Black or African American alone, percent : | 0.4% |
| American Indian and Alaska Native only, % : | 1.2% |
| Asians alone % : | 7.8% |
| Only Native Hawaiians and Other Pacific Islanders, % : | 0.5% |
| % of people who have participated in two or more races : | 0.0% |
| % of Hispanic or Latino : | 32.7% |
| White people, not Hispanic or Latino people, make up the majority of the population. : | 57.4% |
| 2015-2019 Veterans : | 426 |
| Percentage of foreign-born people, 2015-2019 : | 13.5% |
| Rate of owner-occupied housing units, 2015-2019 : | 66.5% |
Economic Facts
| Rate of owner-occupied housing units, 2015-2019 : | 66.5% |
| Owner-occupied housing unit median value, 2015-2019 : | $334,300 |
| From 2015 to 2019, the median selected monthly owner costs - with a mortgage : | $1,943 |
| Monthly owner costs, without a mortgage, at the median, 2015-2019 : | $489 |
| 2015-2019 median gross rent : | $1,712 |
| 2015-2019 Households : | 2,486 |
| Population per household, 2015-2019 : | 3.00 |
| Living in the same house a year ago, percentage of people aged one year and up, 2015-2019 : | 87.7% |
| Languages other than English spoken at home, as a percentage of people aged 5 and up, 2015-2019 : | 29.9% |
| Households with computers, %, 2015-2019 : | 91.5% |
| Percentage of households with a broadband Internet subscription, 2015-2019 : | 86.2% |
| Percentage of people aged 25 and up with a high school diploma or higher, 2015-2019 : | 86.0% |
| Bachelor's degree or higher, proportion of people aged 25 and up, 2015-2019 : | 22.0% |
| Percentage of people under the age of 65 who have a disability, 2015-2019 : | 5.3% |
| Persons under the age of 65 who do not have health insurance, as a percentage : | 4.0% |
| Total civilian labor force, percent of population aged 16 and up, 2015-2019 : | 68.7% |
| Female labor force participation in the civilian labor force, as a percentage of the population aged 16 and up, 2015-2019 : | 61.3% |
| Total sales of lodging and food services in 2012 ($1,000) : | 1,161 |
| Manufacturers' total shipments in 2012 ($1,000) : | 87,562 |
| 2012 total retail sales ($1,000) : | 21,601 |
| 2012 total retail sales per capita : | $3,160 |
| Mean commute time to work (in minutes), workers aged 16 and up, 2015-2019 : | 28.6 |
| 2015-2019 median household income (in 2019 dollars) : | $79,455 |
| Income per capita in the previous 12 months (in 2019 dollars), 2015-2019 : | $33,014 |
| Percentage of people living in poverty : | 6.7% |
| Total number of businesses in 2012 : | 502 |
| Men-owned businesses in 2012 : | 207 |
| Women-owned businesses in 2012 : | 222 |
| Minority-owned businesses in 2012 : | 217 |
| Non-minority-owned businesses in 2012 : | 255 |
| Veteran-owned businesses in 2012 : | 103 |
| Nonveteran-owned businesses in 2012 : | 389 |
| 2010 population per square mile : | 3,658.0 |
| 2010 land area in square miles : | 1.82 |
Best Things to Do in Crete
1Plum Creek Greenway Trail - Goodenow Road Access
E Goodenow Rd, Crete, IL 60417, United States View details
Phone: +18157278700 | Website available

People born in Crete (12)
People born in Crete, including Catholic cardinal and antipope 1409 to 1410 Alexander V, Greek saint Saint Titos, Egyptian politician Mustafa Fahmi Pasha, .
More notable people
- Patriarch Gregory III of Constantinople (Ecumenical Patriarch) he was born in 01/01/1450
- Patriarch Athanasios II of Constantinople (patriarch of Constantinople)
- Andrew of Crete (Byzantine iconophile martyr) he was born in 01/01/0700
- George of Trebizond (Greek philosopher) he was born in 11/04/1395
- Mesomedes (Greek poet and composer of the early 2nd century AD) he was born in 01/01/0001
- Dimitrios Kallergis (Greek politician (1803-1867)) he was born in 01/01/1803
- Athanasios III of Constantinople he was born in 01/01/1597
- Manuel Sklavos he was born in 08/09/9182
- Andromachus the Elder (Greek physician of the 1st century) he was born in 01/01/0050
Nearby Schools and Colleges
Schools and campuses linked to Crete, IL. Select a name to open its map and contact details.
| Code | Name | City | ZIP |
|---|---|---|---|
| 145336 | Governors State University | University Park (IL) | 60484 |
Nearby Transit Stations (20)
Rail and bus stations connected to Crete, IL. Select a station to open its map and address details.
| Code | Name | Address | Type |
|---|---|---|---|
| DYE | Dyer station | 913 Sheffield Avenue | RAIL |
| HMW | Homewood | 18015 Park Ave. | RAIL |
| HMI | Hammond–Whiting station | 1135 South Calumet Ave. | RAIL |
| GRY | Gary, IN | 100 West 4th Avenue | BUS |
| JOL | Joliet Transportation Center | 50 East Jefferson Street | RAIL |
Closest post offices linked to Crete.
| Post Office Name | City | ZIP |
|---|---|---|
| Cr Post Office | Crete (IL) | 60417 |
Other places with the same name (1)
- Crete, Nebraska town in Saline County, Nebraska, United States with a population of 6,875 people.
Other cities in Will County
Cities, towns, neighborhoods & other populated places in Will County , IL. (more)
| City Name | Population | Title |
|---|---|---|
| Joliet | 85,583 | The second most populous city in Will County, Illinois. |
| Bolingbrook | 74,025 | Town in Illinois |
| Lockport | 59,877 | The most populous city in Will County, Illinois. |
| Romeoville | 39,770 | Town |
| New Lenox | 27,088 | Village in Illinois |
| Homer Glen | 24,281 | Village in Illinois, United States |
| Crest Hill | 21,153 | City in Will County, Illinois, United States |
| Mokena | 20,050 | City in Illinois, United States of America |
| Goodings Grove | 18,569 | City in Illinois, United States of America |
| Shorewood | 17,495 | Village in Illinois |
| Channahon | 13,409 | City in Illinois, United States of America |
| Frankfort Square | 9,276 | Census-designated place in Will County, Illinois, United States |
| Manhattan | 8,798 | Village in Illinois |
| Braidwood | 6,148 | City in Will County, Illinois, United States |
| Wilmington | 5,597 | Town in Will County, Illinois, United States |
| Monee | 5,029 | City in Illinois, United States of America |
Distance to Other Cities
Crete distances to largest Illinois cities
- Chicago
- Aurora
- Naperville
- Rockford
- Springfield
- Elgin
- Peoria
- Champaign
- Joliet
- Waukegan
- Cicero
- Bloomington
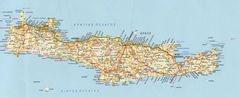
Map & Images (more maps)
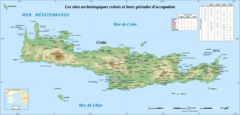
Crete Archaeological Sites Fr
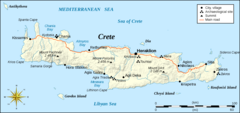
Crete Integrated Map
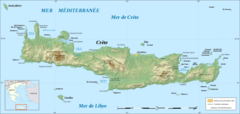
Crete Relief Map Fr
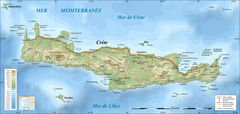
Crete Topographic Map Fr
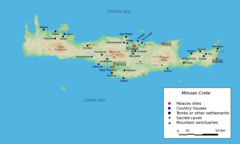
Map Minoan Crete