McLean, Illinois
McLean: village in McLean County, Illinois, United States
About
McLean is a village located in the county of McLean in the U.S. state of Illinois. Its population at the 2010 census was 830 and a population density of 1,930 people per km². After 10 years in 2020 city had an estimated population of 790 inhabitants.
The village was created 171 years ago in 1854.
Quick Facts about McLean
| Population | 790 (2020) |
| Country | United States of America |
| State | Illinois (United States) |
| County | McLean County |
| Area | 0.43 km2 |
| Latitude & Longitude | 40.3145,-89.1698 |
| Altitude | 2,323 feet / 708 meters |
| Establishment | January 01, 1855 (171 years ago) |
| Time Zone | America/Chicago |
| Local time | 10:53:41 (3rd August 2026) |
| Density | 1,837 Pop. per km² as of 2020 |
| Population growth | -5.06% (2010-2020) |
| Weather | 60℉ Mostly Clear 7-days weather |
Geography
McLean is located at 40°18'52"N 89°10'11"W (40.3144800, -89.1698100).
McLean map
Weather
Mostly clear, with a low around 60. North northeast wind around 5 mph.
7-Day ForecastDemographics
According to census records, the population of McLean decreased by 5.06% in 10 years.
| Year | Population | % Change | Method |
|---|---|---|---|
| 2010 | 830 | - | census |
| 2011 | 831 | 0.12% | estimation process |
| 2012 | 833 | 0.24% | estimation process |
| 2013 | 839 | 0.72% | estimation process |
| 2014 | 828 | -1.33% | estimation process |
| 2015 | 819 | -1.1% | estimation process |
| 2016 | 815 | -0.49% | estimation process |
| 2017 | 808 | -0.87% | estimation process |
| 2018 | 801 | -0.87% | estimation process |
| 2019 | 795 | -0.75% | estimation process |
| 2020 | 790 | -0.63% | estimation process |
Demographic Facts
| Estimated population as of July 1, 2019 : | 64,386 |
| Based on demographic estimates as of April 1, 2010 : | 64,662 |
| Based on demographic estimates as of 1 April 2010 : | -0.4% |
| April 1, 2020 Population : | 68,163 |
| April 1, 2010 Population : | 64,665 |
| People under 5 years old, percentage : | 5.9% |
| People under 18 years old, percentage : | 21.2% |
| People over 65 (%) : | 23.1% |
| Female persons, % : | 50.0% |
| White only, percent : | 87.0% |
| Black or African American alone, percent : | 2.1% |
| American Indian and Alaska Native only, % : | 4.5% |
| Asians alone % : | 1.4% |
| Only Native Hawaiians and Other Pacific Islanders, % : | 0.3% |
| % of people who have participated in two or more races : | 4.7% |
| % of Hispanic or Latino : | 22.0% |
| White people, not Hispanic or Latino people, make up the majority of the population. : | 68.9% |
| 2015-2019 Veterans : | 5,360 |
| Percentage of foreign-born people, 2015-2019 : | 8.7% |
| Residential units, July 1, 2019 : | 34,572 |
Economic Facts
| Residential units, July 1, 2019 : | 34,572 |
| Rate of owner-occupied housing units, 2015-2019 : | 66.4% |
| Owner-occupied housing unit median value, 2015-2019 : | $219,400 |
| From 2015 to 2019, the median selected monthly owner costs - with a mortgage : | $1,561 |
| Monthly owner costs, without a mortgage, at the median, 2015-2019 : | $505 |
| 2015-2019 median gross rent : | $978 |
| Permits for construction, 2020 : | 104 |
| 2015-2019 Households : | 25,660 |
| Population per household, 2015-2019 : | 2.46 |
| Living in the same house a year ago, percentage of people aged one year and up, 2015-2019 : | 82.6% |
| Languages other than English spoken at home, as a percentage of people aged 5 and up, 2015-2019 : | 16.2% |
| Households with computers, %, 2015-2019 : | 87.4% |
| Percentage of households with a broadband Internet subscription, 2015-2019 : | 76.6% |
| Percentage of people aged 25 and up with a high school diploma or higher, 2015-2019 : | 85.8% |
| Bachelor's degree or higher, proportion of people aged 25 and up, 2015-2019 : | 15.5% |
| Percentage of people under the age of 65 who have a disability, 2015-2019 : | 13.4% |
| Persons under the age of 65 who do not have health insurance, as a percentage : | 9.4% |
| Total civilian labor force, percent of population aged 16 and up, 2015-2019 : | 50.9% |
| Female labor force participation in the civilian labor force, as a percentage of the population aged 16 and up, 2015-2019 : | 48.2% |
| Total sales of lodging and food services in 2012 ($1,000) : | 88,833 |
| Total receipts/revenue for health care and social assistance in 2012 ($1,000) : | 256,618 |
| Manufacturers' total shipments in 2012 ($1,000) : | 80,536 |
| 2012 total retail sales ($1,000) : | 522,337 |
| 2012 total retail sales per capita : | $8,164 |
| Mean commute time to work (in minutes), workers aged 16 and up, 2015-2019 : | 30.7 |
| 2015-2019 median household income (in 2019 dollars) : | $47,040 |
| Income per capita in the previous 12 months (in 2019 dollars), 2015-2019 : | $27,362 |
| Percentage of people living in poverty : | 18.3% |
| Total number of employer establishments, 2019 : | 1,111 |
| 2019 total employment : | 10,001 |
| 2019 total annual payroll ($1,000) : | 415,666 |
| Total employment, change in percentage terms, 2018-2019 : | 0.5% |
| 2018 total non-employer establishments : | 3,898 |
| Total number of businesses in 2012 : | 4,466 |
| Men-owned businesses in 2012 : | 2,293 |
| Women-owned businesses in 2012 : | 1,624 |
| Minority-owned businesses in 2012 : | 639 |
| Non-minority-owned businesses in 2012 : | 3,713 |
| Veteran-owned businesses in 2012 : | 503 |
| Nonveteran-owned businesses in 2012 : | 3,812 |
| 2010 population per square mile : | 51.5 |
| 2010 land area in square miles : | 1,256.46 |
Best Things to Do in McLean
1Arcadia: America's Playable Arcade Museum
107 S Hamilton St, McLean, IL 61754, United States View details
Phone: +13092871725 | Website available

2Sugar Grove Nature Center
4532 N 725 East Rd, McLean, IL 61754, United States View details
Phone: +13098742174 | Website available
3Funks Grove Nature Preserve
McLean, IL 61754, United States View details
Website available

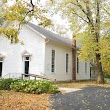
4Funks Grove Church
7054 E 535 North Rd, McLean, IL 61754, United States View details
Phone: +13098742853 | Website available
Nearby Schools and Colleges
Schools and campuses linked to McLean, IL. Select a name to open its map and contact details.
| Code | Name | City | ZIP |
|---|---|---|---|
| 146667 | Lincoln Christian University | Lincoln (IL) | 62656-2111 |
Nearby Transit Stations (10)
Rail and bus stations connected to McLean, IL. Select a station to open its map and address details.
| Code | Name | Address | Type |
|---|---|---|---|
| LCN | Lincoln | Broadway and North Chicago Sts. | RAIL |
| BNL | Uptown Station | 100 East Parkinson St. | RAIL |
| PIA | Peoria, Illinois | 6100 West Everett M. Dirksen Parkway | BUS |
| SPI | Springfield station | East Washington and North Third Sts. | RAIL |
| PON | Pontiac station | 721 West Washington St. | RAIL |
Closest post offices linked to McLean.
| Post Office Name | City | ZIP |
|---|---|---|
| Mc Lean Post Office | Mc Lean (IL) | 61754 |
Other places with the same name (4)
- McLean, Virginia A city in Fairfax County, Virginia. with a population of 48,115 people.
- McLean, Ohio human settlement in United States of America with a population of 3,288 people.
- McLean, Texas town in Gray County, Texas, United States with a population of 742 people.
- McLean, Nebraska town in Nebraska, United States with a population of 36 people.
Other cities in McLean County
Cities, towns, neighborhoods & other populated places in McLean County , IL. (more)
| City Name | Population | Title |
|---|---|---|
| Bloomington | 77,132 | The second most populous city in McLean County, Illinois. |
| Normal | 54,451 | Town in McLean County, Illinois, United States |
| Empire | 4,024 | Township in McLean County, Illinois |
| Le Roy | 3,498 | City in McLean County, Illinois, United States |
| Heyworth | 2,869 | Village in McLean County, Illinois, United States of America |
| Lexington | 2,020 | City in McLean County, Illinois, United States |
| Hudson | 1,810 | Village in McLean County, Illinois, United States |
| Chenoa | 1,717 | City in Illinois |
| Gridley | 1,392 | Township in McLean County, Illinois |
| Danvers | 1,093 | Township in McLean County, Illinois |
| Colfax | 1,009 | Village in McLean County, Illinois, United States |
| Downs | 949 | Village in Illinois, USA |
| Saybrook | 679 | Human settlement in Illinois, United States of America |
| Carlock | 558 | Human settlement in Illinois, United States of America |
| Towanda | 517 | Township in McLean County, Illinois |
| Stanford | 507 | Human settlement in United States of America |