Loves Park, Illinois
Loves Park: city north of Rockford, Illinois
About
Loves Park is a city located in the county of Winnebago in the U.S. state of Illinois. Its population at the 2010 census was 23,996 and a population density of 550 people per km². After 10 years in 2020 city had an estimated population of 23,382 inhabitants.

Quick Facts about Loves Park
| Population | 23,382 (2020) |
| Country | United States of America |
| State | Illinois (United States) |
| County | Winnebago County |
| Area | 43.63 km2 |
| Latitude & Longitude | 42.3200,-89.0582 |
| Altitude | 2,388 feet / 728 meters |
| Time Zone | America/Chicago |
| Local time | 06:15:19 (14th July 2026) |
| Postal code | 61111 |
| Density | 536 Pop. per km² as of 2020 |
| Population growth | -2.63% (2010-2020) |
| Weather | 93℉ Sunny 7-days weather |
Geography
Loves Park is located at 42°19'12"N 89°3'29"W (42.3200200, -89.0581600).
Loves Park map
Official website of Loves Park
Official WebsiteDemographics
According to census records, the population of Loves Park decreased by 2.63% in 10 years.
| Year | Population | % Change | Method |
|---|---|---|---|
| 2010 | 23,996 | - | census |
| 2011 | 23,904 | -0.38% | estimation process |
| 2012 | 23,798 | -0.45% | estimation process |
| 2013 | 23,735 | -0.27% | estimation process |
| 2014 | 23,579 | -0.66% | estimation process |
| 2015 | 23,489 | -0.38% | estimation process |
| 2016 | 23,463 | -0.11% | estimation process |
| 2017 | 23,377 | -0.37% | estimation process |
| 2018 | 23,330 | -0.2% | estimation process |
| 2019 | 23,371 | 0.18% | estimation process |
| 2020 | 23,382 | 0.05% | estimation process |
Demographic Facts
| Estimated population as of July 1, 2019 : | 15,506 |
| Based on demographic estimates as of April 1, 2010 : | 12,707 |
| Based on demographic estimates as of 1 April 2010 : | 22.0% |
| April 1, 2020 Population : | 14,161 |
| April 1, 2010 Population : | 12,707 |
| People under 5 years old, percentage : | 8.9% |
| People under 18 years old, percentage : | 34.4% |
| People over 65 (%) : | 4.4% |
| Female persons, % : | 44.1% |
| White only, percent : | 89.8% |
| Black or African American alone, percent : | 1.1% |
| American Indian and Alaska Native only, % : | 0.3% |
| Asians alone % : | 0.1% |
| Only Native Hawaiians and Other Pacific Islanders, % : | 0.0% |
| % of people who have participated in two or more races : | 2.2% |
| % of Hispanic or Latino : | 94.7% |
| White people, not Hispanic or Latino people, make up the majority of the population. : | 3.4% |
| 2015-2019 Veterans : | 83 |
| Percentage of foreign-born people, 2015-2019 : | 36.6% |
| Rate of owner-occupied housing units, 2015-2019 : | 58.2% |
Economic Facts
| Rate of owner-occupied housing units, 2015-2019 : | 58.2% |
| Owner-occupied housing unit median value, 2015-2019 : | $171,000 |
| From 2015 to 2019, the median selected monthly owner costs - with a mortgage : | $1,145 |
| Monthly owner costs, without a mortgage, at the median, 2015-2019 : | $325 |
| 2015-2019 median gross rent : | $903 |
| 2015-2019 Households : | 3,269 |
| Population per household, 2015-2019 : | 4.14 |
| Living in the same house a year ago, percentage of people aged one year and up, 2015-2019 : | 94.8% |
| Languages other than English spoken at home, as a percentage of people aged 5 and up, 2015-2019 : | 79.5% |
| Households with computers, %, 2015-2019 : | 69.7% |
| Percentage of households with a broadband Internet subscription, 2015-2019 : | 62.0% |
| Percentage of people aged 25 and up with a high school diploma or higher, 2015-2019 : | 51.9% |
| Bachelor's degree or higher, proportion of people aged 25 and up, 2015-2019 : | 3.4% |
| Percentage of people under the age of 65 who have a disability, 2015-2019 : | 2.0% |
| Persons under the age of 65 who do not have health insurance, as a percentage : | 8.2% |
| Total civilian labor force, percent of population aged 16 and up, 2015-2019 : | 56.3% |
| Female labor force participation in the civilian labor force, as a percentage of the population aged 16 and up, 2015-2019 : | 55.6% |
| Total sales of lodging and food services in 2012 ($1,000) : | 1,483 |
| Total receipts/revenue for health care and social assistance in 2012 ($1,000) : | 3,121 |
| 2012 total retail sales ($1,000) : | 36,429 |
| 2012 total retail sales per capita : | $2,939 |
| Mean commute time to work (in minutes), workers aged 16 and up, 2015-2019 : | 19.8 |
| 2015-2019 median household income (in 2019 dollars) : | $35,346 |
| Income per capita in the previous 12 months (in 2019 dollars), 2015-2019 : | $10,957 |
| Percentage of people living in poverty : | 32.4% |
| Total number of businesses in 2012 : | 332 |
| Men-owned businesses in 2012 : | 182 |
| Women-owned businesses in 2012 : | 123 |
| Minority-owned businesses in 2012 : | 255 |
| Non-minority-owned businesses in 2012 : | 71 |
| Veteran-owned businesses in 2012 : | 36 |
| Nonveteran-owned businesses in 2012 : | 289 |
| 2010 population per square mile : | 4,762.7 |
| 2010 land area in square miles : | 2.67 |
| Rate of owner-occupied housing units, 2015-2019 : | 50.4% |
| Owner-occupied housing unit median value, 2015-2019 : | $192,000 |
| From 2015 to 2019, the median selected monthly owner costs - with a mortgage : | $1,759 |
| Monthly owner costs, without a mortgage, at the median, 2015-2019 : | $666 |
| 2015-2019 median gross rent : | $995 |
| 2015-2019 Households : | 7,888 |
| Population per household, 2015-2019 : | 3.23 |
| Living in the same house a year ago, percentage of people aged one year and up, 2015-2019 : | 88.7% |
| Languages other than English spoken at home, as a percentage of people aged 5 and up, 2015-2019 : | 71.3% |
| Households with computers, %, 2015-2019 : | 87.2% |
| Percentage of households with a broadband Internet subscription, 2015-2019 : | 71.3% |
| Percentage of people aged 25 and up with a high school diploma or higher, 2015-2019 : | 71.9% |
| Bachelor's degree or higher, proportion of people aged 25 and up, 2015-2019 : | 12.8% |
| Percentage of people under the age of 65 who have a disability, 2015-2019 : | 5.7% |
| Persons under the age of 65 who do not have health insurance, as a percentage : | 16.3% |
| Total civilian labor force, percent of population aged 16 and up, 2015-2019 : | 67.0% |
| Female labor force participation in the civilian labor force, as a percentage of the population aged 16 and up, 2015-2019 : | 58.5% |
| Total receipts/revenue for health care and social assistance in 2012 ($1,000) : | 365,574 |
| Manufacturers' total shipments in 2012 ($1,000) : | 1,763,838 |
| 2012 total retail sales ($1,000) : | 931,490 |
| 2012 total retail sales per capita : | $36,490 |
| Mean commute time to work (in minutes), workers aged 16 and up, 2015-2019 : | 27.0 |
| 2015-2019 median household income (in 2019 dollars) : | $50,870 |
| Income per capita in the previous 12 months (in 2019 dollars), 2015-2019 : | $20,992 |
| Percentage of people living in poverty : | 17.2% |
| Total number of businesses in 2012 : | 2,101 |
| Men-owned businesses in 2012 : | 1,250 |
| Women-owned businesses in 2012 : | 616 |
| Minority-owned businesses in 2012 : | 995 |
| Non-minority-owned businesses in 2012 : | 971 |
| Veteran-owned businesses in 2012 : | 207 |
| Nonveteran-owned businesses in 2012 : | 1,773 |
| 2010 population per square mile : | 5,996.3 |
| 2010 land area in square miles : | 4.24 |
Best Things to Do in Loves Park
1Rock Cut State Park
7318 Harlem Rd, Loves Park, IL 61111, United States View details
Phone: +18158853311 | Website available

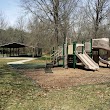
2Martin Park
Martin Memorial Park, Loves Park, IL 61111, United States View details
Phone: +18159878800 | Website available
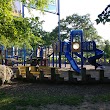
3Sapora Playworld
Inside Carlson Ice Arena, 4150 N Perryville Rd, Loves Park, IL 61111, United States View details
Phone: +18159694082 | Website available

4Wantz Park
Loves Park, IL 61111, United States View details
Phone: +18159878800

5Puri Crest Picnic Area
Loves Park, IL 61115, United States View details
Where to Eat in Loves Park
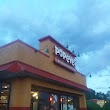
1Popeyes Louisiana Kitchen
5207 N 2nd St, Loves Park, IL 61111, United States View details
Phone: +18156334342 | Website available
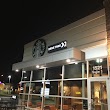
2Starbucks
1521 E Riverside Blvd, Loves Park, IL 61111, United States View details
Phone: +17795009703 | Website available
3Burger King
1804 E Riverside Blvd, Loves Park, IL 61111, United States View details
Phone: +18156339800 | Website available
4Jimmy John's
6112 N 2nd St, Loves Park, IL 61111, United States View details
Phone: +18153167766 | Website available

5Subway
6200 N 2nd St, Loves Park, IL 61111, United States View details
Phone: +18156547827 | Website available

Where to Stay in Loves Park
1Quality Inn & Suites
4313 N Bell School Rd, Loves Park, IL 61111, United States View details
Phone: +18152829300 | Website available
People born in Loves Park (2)
People born in Loves Park, including cartoonist Dick Kulpa, volleyball player Trevor Weiskircher, .
More notable people
Nearby Schools and Colleges
Schools and campuses linked to Loves Park, IL. Select a name to open its map and contact details.
| Code | Name | City | ZIP |
|---|---|---|---|
| 260965 | Educators of Beauty College of Cosmetology-Rockford | Rockford (IL) | 61114 |
Nearby Transit Stations (15)
Rail and bus stations connected to Loves Park, IL. Select a station to open its map and address details.
| Code | Name | Address | Type |
|---|---|---|---|
| RCK | Rockford, Illinois | 7559 Walton St. | BUS |
| BET | South Beloit, Illinois | 15766 Manchester Road | BUS |
| JVL | Janesville, Wisconsin | 3120 North Pontiac Drive | BUS |
| SMD | Madison (South), Wisconsin | Hwy 51 & East Broadway Ave. | BUS |
| PLO | Plano | 101 West Main Street | RAIL |
Closest post offices linked to Loves Park.
| Post Office Name | City | ZIP |
|---|---|---|
| Loves Park Post Office | Loves Park (IL) | 61111 |
Other cities in Winnebago County
Cities, towns, neighborhoods & other populated places in Winnebago County , IL.
| City Name | Population | Title |
|---|---|---|
| Rockford | 144,835 | The second most populous city in Illinois. |
| Machesney Park | 22,678 | Village in the U. |
| Roscoe | 10,406 | Town |
| South Beloit | 7,540 | City in Winnebago County, Illinois, United States |
| Rockton | 7,477 | Illinois village near the Wisconsin border |
| Winnebago | 2,973 | City in Minnesota, United States |
| Cherry Valley | 2,853 | Township in Winnebago County, Illinois |
| Harlem | 2,114 | Township in Winnebago County, Illinois, United States |
| Lake Summerset | 2,048 | Census designated place |
| Pecatonica | 1,926 | City in Illinois, United States of America |
| Durand | 1,387 | Village in the United States |
| Shirland | 944 | Township in Winnebago County, Illinois |
| Seward | 874 | Human settlement in Illinois, United States of America |
| New Milford | 851 | Human settlement in Illinois, United States of America |
Distance to Other Cities
Loves Park distances to largest Illinois cities