Qatar (State of Qatar), QA
Qatar: Located on the northeastern coast of the Arabian Peninsula, this sovereign Arab state is known for its vast natural gas and oil reserves.
About

Country Snapshot
State of Qatar at a glance
State of Qatar currently has 8 quality-checked populated place pages and 7 state or regional pages linked on MapSof.
Mapped cities & towns
8
These counts use a stricter populated-place filter so the main lists stay focused on real city and town pages.
States & regions
7
Open related pagesLargest city
DohaPopulation 587,055
Top linked places
Quick Facts about State of Qatar
| Population | 3,173,024 |
| Country | Qatar |
| Plate code | Q |
| Area | 11437 km2 |
| Official name | l’État du Qatar |
| Has part | Doha |
| Continent | Asia |
| Easternmost point | Point(51.55 24.98) |
| Northernmost point | Point(51.23 26.18) |
| Latitude & Longitude | 25.5000,51.2500 |
| Legislative body | Consultative Assembly of Qatar |
| Official language | Arabic |
| Capital | Doha |
| Establishment | January 01, 1870 (156 years ago) |
| Time Zone | UTC+03:00 |
| Local time | 09:39:02 (26th July 2026) |

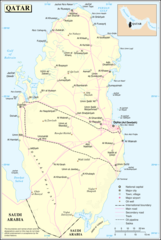
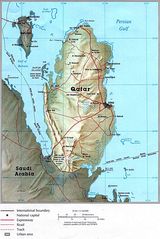
Geography
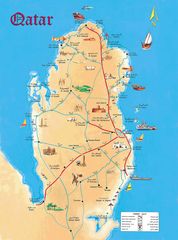
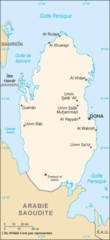
State of Qatar is located at 25°30'0"N 51°15'0"E (25.5000000, 51.2500000).
Qatar map
The largest city of State of Qatar is Doha with a population of 587,055. Other cities include and Al Wakrah population 26,436. See all State of Qatar cities & populated places.
- Mesaieed
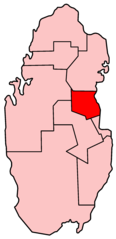
- Al Khor
- Ad Dawhah
- Jariyan al Batnah
- Madinat ash Shamal
- Umm Salal Municipality
- Al Ghuwariyah
- Al Wakrah
- Al Rayyan Municipality
- Al Jumaliyah
Demographics
| Year | Population | % Change | Method |
|---|---|---|---|
| 1960 | 47,316 | - | census |
| 1961 | 51,363 | 7.88% | census |
| 1962 | 56,196 | 8.6% | census |
| 1963 | 61,657 | 8.86% | census |
| 1964 | 67,497 | 8.65% | census |
| 1965 | 73,554 | 8.23% | census |
| 1966 | 79,746 | 7.76% | census |
| 1967 | 86,172 | 7.46% | census |
| 1968 | 93,056 | 7.4% | census |
| 1969 | 100,710 | 7.6% | census |
| 1970 | 109,342 | 7.89% | census |
| 1971 | 119,260 | 8.32% | census |
| 1972 | 130,390 | 8.54% | census |
| 1973 | 142,126 | 8.26% | census |
| 1974 | 153,610 | 7.48% | census |
| 1975 | 164,354 | 6.54% | census |
| 1976 | 173,786 | 5.43% | census |
| 1977 | 182,404 | 4.72% | census |
| 1978 | 192,059 | 5.03% | census |
| 1979 | 205,286 | 6.44% | census |
| 1980 | 223,752 | 8.25% | census |
| 1981 | 248,077 | 9.81% | census |
| 1982 | 277,245 | 10.52% | census |
| 1983 | 309,256 | 10.35% | census |
| 1984 | 341,249 | 9.38% | census |
| 1985 | 371,026 | 8.03% | census |
| 1986 | 398,284 | 6.84% | census |
| 1987 | 423,300 | 5.91% | census |
| 1988 | 445,197 | 4.92% | census |
| 1989 | 463,079 | 3.86% | census |
| 1990 | 476,517 | 2.82% | census |
| 1991 | 485,129 | 1.78% | census |
| 1992 | 489,606 | 0.91% | census |
| 1993 | 491,996 | 0.49% | census |
| 1994 | 495,106 | 0.63% | census |
| 1995 | 501,154 | 1.21% | census |
| 1996 | 512,476 | 2.21% | census |
| 1997 | 529,491 | 3.21% | census |
| 1998 | 550,367 | 3.79% | census |
| 1999 | 572,155 | 3.81% | census |
| 2000 | 593,693 | 3.63% | census |
| 2001 | 611,808 | 2.96% | census |
| 2002 | 629,745 | 2.85% | census |
| 2003 | 660,238 | 4.62% | census |
| 2004 | 720,384 | 8.35% | census |
| 2005 | 821,159 | 12.27% | census |
| 2006 | 967,602 | 15.13% | census |
| 2007 | 1,152,459 | 16.04% | census |
| 2008 | 1,359,114 | 15.21% | census |
| 2009 | 1,564,087 | 13.1% | census |
| 2010 | 1,765,513 | 11.41% | census |
| 2011 | 1,910,902 | 7.61% | census |
| 2012 | 2,050,514 | 6.81% | census |
| 2013 | 2,168,673 | 5.45% | census |
| 2014 | 2,459,198 | 11.81% | (Worldbank) |
| 2015 | 2,565,710 | 4.15% | (Worldbank) |
| 2016 | 2,654,374 | 3.34% | (Worldbank) |
| 2017 | 2,639,211 | -0.57% | census |
| 2018 | 2,781,677 | 5.12% | (Worldbank) |
| 2019 | 2,832,067 | 1.78% | (Worldbank) |
| 2026 | 3,173,024 | 10.75% |
Map & Images (more maps)
Map Praying Mantis 2
Mapa Katar
Qa Map
Qatar Carte
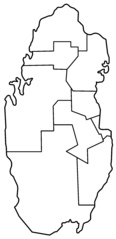
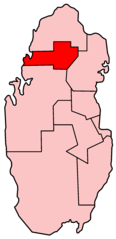
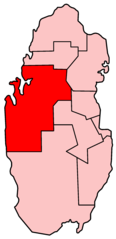
Qatar Governorates Blank
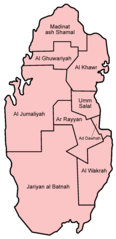
Qatar Governorates English
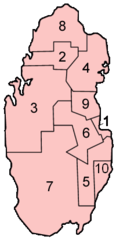
Qatar Governorates Numbered English
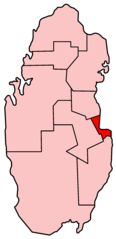
Qatar Ad Dawhah
Qatar Al Ghuwariyah
Qatar Al Jumaliyah
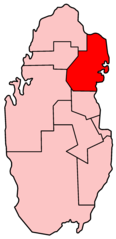
Qatar Al Khawr
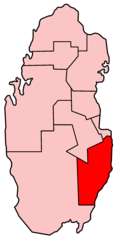
Qatar Al Wakrah
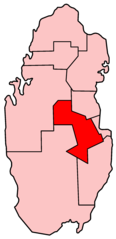
Qatar Ar Rayyan
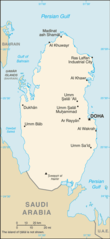
Qatar Cia Wfb Map
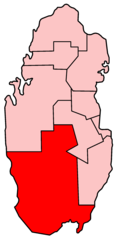
Qatar Jariyan Al Batnah
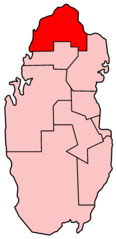
Qatar Madinat Ash Shamal
Qatar Umm Salal
Un Qatar

Qatar Flag Map
Qatar Map