Papua New Guinea (Independent State of Papua New Guinea), PG
Papua New Guinea: This Oceanic country occupies the eastern half of the island of New Guinea and its offshore islands, situated in the southwestern Pacific Ocean.
About
Country Snapshot
Independent State of Papua New Guinea at a glance
Independent State of Papua New Guinea currently has 19 quality-checked populated place pages and 2 state or regional pages linked on MapSof.
Mapped cities & towns
19
These counts use a stricter populated-place filter so the main lists stay focused on real city and town pages.
States & regions
2
Open related pagesLargest city
Port MoresbyPopulation 283,733
Top linked places
Quick Facts about Independent State of Papua New Guinea
| Population | 11,781,559 |
| Country | Papua New Guinea |
| Different from | Guinea |
| Plate code | PNG |
| Area | 462840 km2 |
| Official name | Papua New Guinea, l’État indépendant de Papouasie- Nouvelle-Guinée |
| Continent | Oceania |
| Easternmost point | Point(159.4 -4.525) |
| Northernmost point | Point(149.55 -1.32) |
| Latitude & Longitude | -6.0000,147.0000 |
| Legislative body | National Parliament of Papua New Guinea |
| Official language | Tok Pisin, Papua New Guinean Sign Language, Hiri Motu, English |
| Capital | Port Moresby |
| Establishment | January 01, 1975 (51 years ago) |
| Time Zone | UTC+11:00, UTC+10:00 |
| Local time | 13:23:45 (26th July 2026) |
Geography
Independent State of Papua New Guinea is located at 6°0'0"S 147°0'0"E (-6.0000000, 147.0000000). It has 2 neighbors: Indonesia and Australia.
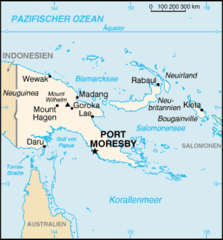
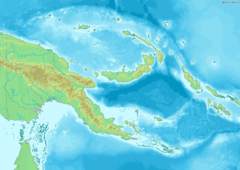
Papua New Guinea map
The largest city of Independent State of Papua New Guinea is Port Moresby with a population of 283,733. Other cities include, Lae population 76,255, Popondetta population 28,198, Kokopo population 26,273 and Wau population 14,629. See all Independent State of Papua New Guinea cities & populated places.
Official website of Independent State of Papua New Guinea
Official WebsiteCompare Independent State of Papua New Guinea with
- Morobe Province
- Oro Province
- Manus Province
- East Sepik Province
- Jiwaka Province
- Enga Province
- Chimbu Province
- Autonomous Region of Bougainville
- West New Britain Province
- National Capital District
- Central Province
- Southern Highlands Province
- Western Province
- Gulf Province
- Western Highlands Province
- Madang Province
- Sandaun Province
- New Ireland Province
- East New Britain Province
- Milne Bay Province
- Hela Province
- Eastern Highlands Province
Demographics
| Year | Population | % Change | Method |
|---|---|---|---|
| 1960 | 1,966,957 | - | census |
| 1961 | 2,001,048 | 1.7% | census |
| 1962 | 2,037,164 | 1.77% | census |
| 1963 | 2,075,629 | 1.85% | census |
| 1964 | 2,116,831 | 1.95% | census |
| 1965 | 2,161,102 | 2.05% | census |
| 1966 | 2,208,421 | 2.14% | census |
| 1967 | 2,258,876 | 2.23% | census |
| 1968 | 2,313,016 | 2.34% | census |
| 1969 | 2,371,514 | 2.47% | census |
| 1970 | 2,434,754 | 2.6% | census |
| 1971 | 2,503,073 | 2.73% | census |
| 1972 | 2,576,093 | 2.83% | census |
| 1973 | 2,652,585 | 2.88% | census |
| 1974 | 2,730,859 | 2.87% | census |
| 1975 | 2,809,692 | 2.81% | census |
| 1976 | 2,888,510 | 2.73% | census |
| 1977 | 2,967,620 | 2.67% | census |
| 1978 | 3,047,769 | 2.63% | census |
| 1979 | 3,130,125 | 2.63% | census |
| 1980 | 3,215,483 | 2.65% | census |
| 1981 | 3,304,188 | 2.68% | census |
| 1982 | 3,395,798 | 2.7% | census |
| 1983 | 3,489,402 | 2.68% | census |
| 1984 | 3,583,707 | 2.63% | census |
| 1985 | 3,677,854 | 2.56% | census |
| 1986 | 3,771,592 | 2.49% | census |
| 1987 | 3,865,448 | 2.43% | census |
| 1988 | 3,960,314 | 2.4% | census |
| 1989 | 4,057,467 | 2.39% | census |
| 1990 | 4,157,903 | 2.42% | census |
| 1991 | 4,261,797 | 2.44% | census |
| 1992 | 4,369,087 | 2.46% | census |
| 1993 | 4,480,243 | 2.48% | census |
| 1994 | 4,595,761 | 2.51% | census |
| 1995 | 4,715,929 | 2.55% | census |
| 1996 | 4,841,020 | 2.58% | census |
| 1997 | 4,970,823 | 2.61% | census |
| 1998 | 5,104,516 | 2.62% | census |
| 1999 | 5,240,941 | 2.6% | census |
| 2000 | 5,379,226 | 2.57% | census |
| 2001 | 5,518,971 | 2.53% | census |
| 2002 | 5,660,267 | 2.5% | census |
| 2003 | 5,803,302 | 2.46% | census |
| 2004 | 5,948,461 | 2.44% | census |
| 2005 | 6,095,959 | 2.42% | census |
| 2006 | 6,245,797 | 2.4% | census |
| 2007 | 6,397,623 | 2.37% | census |
| 2008 | 6,550,877 | 2.34% | census |
| 2009 | 6,704,829 | 2.3% | census |
| 2010 | 6,858,945 | 2.25% | census |
| 2011 | 7,012,977 | 2.2% | census |
| 2012 | 7,167,010 | 2.15% | census |
| 2013 | 7,321,262 | 2.11% | census |
| 2014 | 7,946,731 | 7.87% | (Worldbank) |
| 2015 | 8,107,775 | 1.99% | (Worldbank) |
| 2016 | 8,271,760 | 1.98% | (Worldbank) |
| 2017 | 8,251,162 | -0.25% | census |
| 2018 | 8,606,316 | 4.13% | (Worldbank) |
| 2019 | 8,776,109 | 1.93% | (Worldbank) |
| 2026 | 11,781,559 | 25.51% |
Map & Images (more maps)
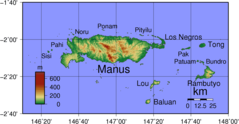
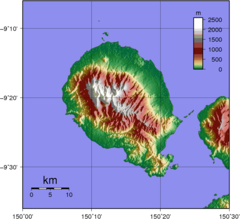
Admiralty Islands Topography With Labels
Ambitletopography
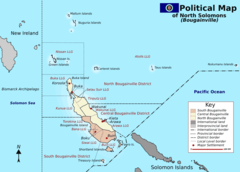
Bvdistricts
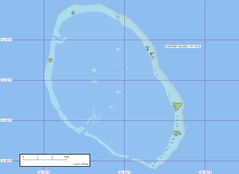
Carteret Map
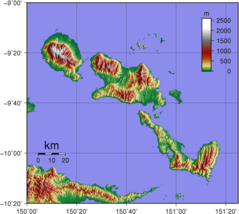
Dentrecasteauxislandstopography
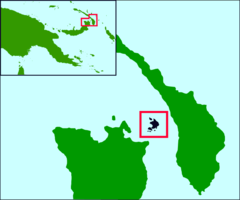
Duke of York Islands Pos
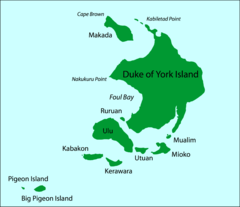
Duke of York Islands
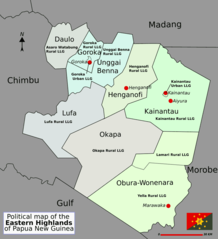
Ehpdistricts
Fergussonislandtopography
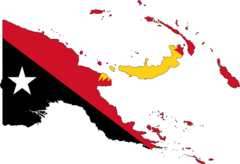
Flag Map of Papua New Guinea
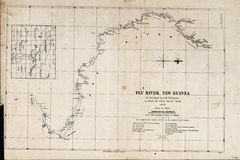
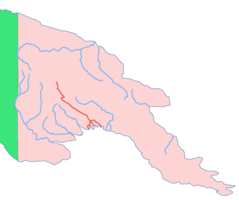
Fly River Map 1876 Nla
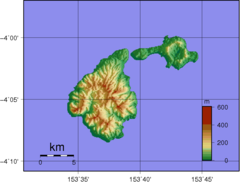
Goodenoughislandtopography
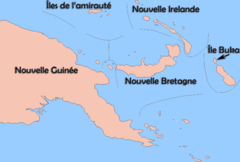
Iles De Nouvelle Guinee
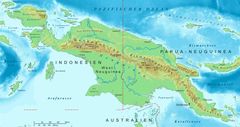
Karte Neuguinea 2

Karte Neuguinea 3
Karte Von Papua Neuguinea
Map of Papua New Guinea Demis
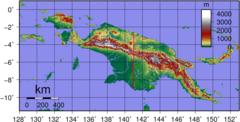
New Guinea Topography 1
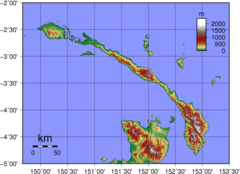
New Ireland Topography
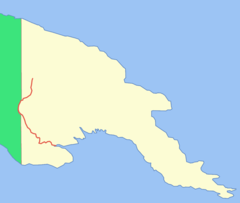
New Guinea Fly River