Oman (Sultanate of Oman), OM
Oman: Located on the southeastern coast of the Arabian Peninsula, this Middle Eastern nation is known for its diverse landscapes, including deserts, mountains, and coastlines.
About

Country Snapshot
Sultanate of Oman at a glance
Sultanate of Oman currently has 17 quality-checked populated place pages and 8 state or regional pages linked on MapSof.
Mapped cities & towns
17
These counts use a stricter populated-place filter so the main lists stay focused on real city and town pages.
States & regions
8
Open related pagesLargest city
MuscatPopulation 1,421,409
Top linked places
Quick Facts about Sultanate of Oman
| Population | 5,343,630 |
| Country | Oman |
| Different from | Muscat and Oman |
| Area | 309500 km2 |
| Official name | le Sultanat d’Oman |
| Continent | Asia |
| Northernmost point | Point(56.38 26.38) |
| Latitude & Longitude | 21.0000,57.0000 |
| Legislative body | Council of Oman |
| Official language | Arabic |
| Capital | Muscat |
| Establishment | July 23, 1970 (56 years ago) |
| Time Zone | UTC+04:00 |
| Local time | 06:13:25 (26th July 2026) |
Geography
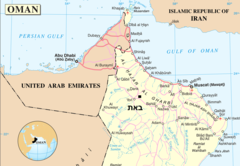
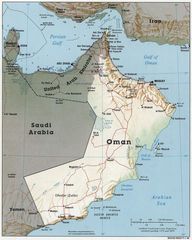
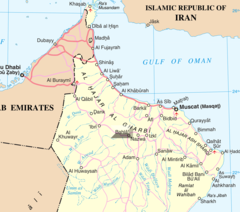
Sultanate of Oman is located at 21°0'0"N 57°0'0"E (21.0000000, 57.0000000). It has 3 neighbors: Yemen, Saudi Arabia and United Arab Emirates.
Oman map
The largest city of Sultanate of Oman is Muscat with a population of 1,421,409. Other cities include, Seeb population 237,816, Şalālah population 163,140 and Nizwá population 72,076. See all Sultanate of Oman cities & populated places.
Compare Sultanate of Oman with
- Al Wusta Governorate
- Al Buraimi Governorate
- Muscat Governorate
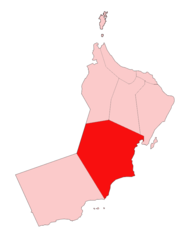
- Ash Sharqiyah South Governorate
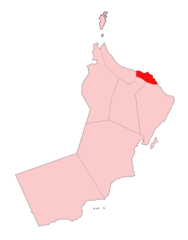
- Ash Sharqiyah North Governorate
- Musandam Governorate
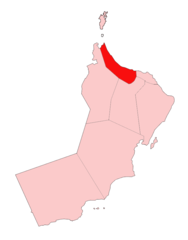
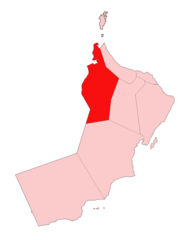
- Al Batinah North Governorate
- Dhofar Governorate
- Ad Dhahirah Governorate
- Ad Dakhiliyah Governorate
- Al Batinah South Governorate
Demographics
| Year | Population | % Change | Method |
|---|---|---|---|
| 1960 | 551,737 | - | statistical updating |
| 1961 | 564,895 | 2.33% | statistical updating |
| 1962 | 578,825 | 2.41% | statistical updating |
| 1963 | 593,504 | 2.47% | statistical updating |
| 1964 | 608,889 | 2.53% | statistical updating |
| 1965 | 625,007 | 2.58% | statistical updating |
| 1966 | 642,005 | 2.65% | statistical updating |
| 1967 | 660,117 | 2.74% | statistical updating |
| 1968 | 679,593 | 2.87% | statistical updating |
| 1969 | 700,729 | 3.02% | statistical updating |
| 1970 | 723,850 | 3.19% | statistical updating |
| 1971 | 748,971 | 3.35% | statistical updating |
| 1972 | 776,379 | 3.53% | statistical updating |
| 1973 | 806,989 | 3.79% | statistical updating |
| 1974 | 841,947 | 4.15% | statistical updating |
| 1975 | 882,044 | 4.55% | statistical updating |
| 1976 | 927,433 | 4.89% | statistical updating |
| 1977 | 977,788 | 5.15% | statistical updating |
| 1978 | 1,032,772 | 5.32% | statistical updating |
| 1979 | 1,091,831 | 5.41% | statistical updating |
| 1980 | 1,154,375 | 5.42% | statistical updating |
| 1981 | 1,220,512 | 5.42% | statistical updating |
| 1982 | 1,289,842 | 5.38% | statistical updating |
| 1983 | 1,360,637 | 5.2% | statistical updating |
| 1984 | 1,430,680 | 4.9% | statistical updating |
| 1985 | 1,498,416 | 4.52% | statistical updating |
| 1986 | 1,562,144 | 4.08% | statistical updating |
| 1987 | 1,622,123 | 3.7% | statistical updating |
| 1988 | 1,681,070 | 3.51% | statistical updating |
| 1989 | 1,742,950 | 3.55% | statistical updating |
| 1990 | 1,810,103 | 3.71% | statistical updating |
| 1991 | 1,885,036 | 3.98% | statistical updating |
| 1992 | 1,965,586 | 4.1% | statistical updating |
| 1993 | 2,043,912 | 3.83% | statistical updating |
| 1994 | 2,109,246 | 3.1% | statistical updating |
| 1995 | 2,154,600 | 2.1% | statistical updating |
| 1996 | 2,175,998 | 0.98% | statistical updating |
| 1997 | 2,177,723 | 0.08% | statistical updating |
| 1998 | 2,171,135 | -0.3% | statistical updating |
| 1999 | 2,172,287 | 0.05% | statistical updating |
| 2000 | 2,192,535 | 0.92% | statistical updating |
| 2001 | 2,239,025 | 2.08% | statistical updating |
| 2002 | 2,308,409 | 3.01% | statistical updating |
| 2003 | 2,389,121 | 3.38% | statistical updating |
| 2004 | 2,464,001 | 3.04% | statistical updating |
| 2005 | 2,522,325 | 2.31% | statistical updating |
| 2006 | 2,554,905 | 1.28% | statistical updating |
| 2007 | 2,569,739 | 0.58% | statistical updating |
| 2008 | 2,593,523 | 0.92% | statistical updating |
| 2009 | 2,663,224 | 2.62% | statistical updating |
| 2010 | 2,802,768 | 4.98% | statistical updating |
| 2011 | 3,024,774 | 7.34% | statistical updating |
| 2012 | 3,314,001 | 8.73% | statistical updating |
| 2013 | 3,632,444 | 8.77% | statistical updating |
| 2014 | 4,027,260 | 9.8% | (Worldbank) |
| 2015 | 4,267,348 | 5.63% | (Worldbank) |
| 2016 | 4,479,219 | 4.73% | (Worldbank) |
| 2017 | 4,636,262 | 3.39% | statistical updating |
| 2018 | 4,829,480 | 4% | statistical updating |
| 2019 | 4,974,986 | 2.92% | (Worldbank) |
| 2026 | 5,343,630 | 6.9% |
Map & Images (more maps)
At0801 Map
At1302 Map
At1306 Map
At1320 Map
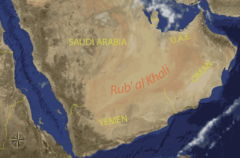
Empty Quarter Arabia
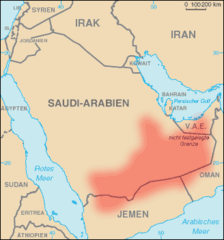
Empty Quarter German
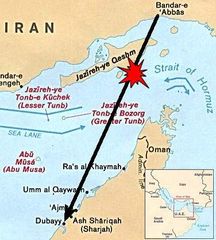
Iran Air 655 Strait of Hormuz 80 1
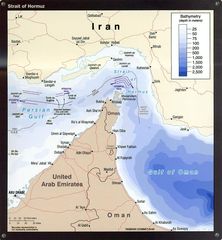
Iran Strait of Hormuz 2004 5
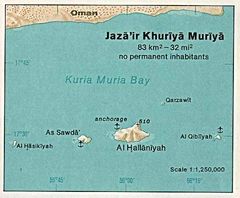
Khuriya Muriya 76
Map Praying Mantis 1
Oman 1996 Cia Map
Oman Al Batinah
Oman Al Wusta
Oman Az Zahirah
Oman Masqat
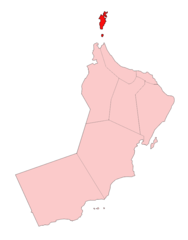
Oman Musandam
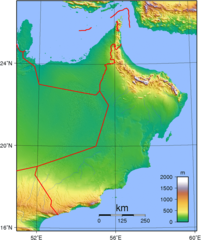
Oman Topography
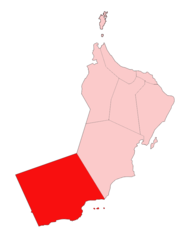
Oman Zufar
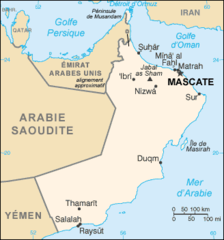
Oman Carte
Oman Bahla