Morton, Illinois
Morton: village in Tazewell County, Illinois
About
Morton is a village located in the county of Tazewell in the U.S. state of Illinois. Its population at the 2010 census was 16,267 and a population density of 481 people per km². After 10 years in 2020 city had an estimated population of 16,232 inhabitants.

Quick Facts about Morton
| Population | 16,232 (2020) |
| Country | United States of America |
| State | Illinois (United States) |
| County | Tazewell County |
| Postal code | 61550 |
| Phone Area Codes | 309 |
| Area | 33.83 km2 |
| Latitude & Longitude | 40.6128,-89.4593 |
| Altitude | 712 feet / 217 meters |
| Time Zone | America/Chicago |
| Local time | 10:41:51 (24th July 2026) |
| Density | 480 Pop. per km² as of 2020 |
| Population growth | -0.22% (2010-2020) |
| Weather | 78℉ Partly Sunny 7-days weather |
Geography
Morton is located at 40°36'46"N 89°27'33"W (40.6128200, -89.4592600).
Morton map
Weather
Partly sunny, with a high near 78. South southeast wind 2 to 6 mph.
7-Day ForecastOfficial website of Morton
Official WebsiteDemographics
According to census records, the population of Morton decreased by 0.22% in 10 years.
| Year | Population | % Change | Method |
|---|---|---|---|
| 2010 | 16,267 | - | census |
| 2011 | 16,447 | 1.09% | estimation process |
| 2012 | 16,540 | 0.56% | estimation process |
| 2013 | 16,656 | 0.7% | estimation process |
| 2014 | 16,614 | -0.25% | estimation process |
| 2015 | 16,416 | -1.21% | estimation process |
| 2016 | 16,421 | 0.03% | estimation process |
| 2017 | 16,437 | 0.1% | estimation process |
| 2018 | 16,351 | -0.53% | estimation process |
| 2019 | 16,293 | -0.36% | estimation process |
| 2020 | 16,232 | -0.38% | estimation process |
Demographic Facts
| Estimated population as of July 1, 2019 : | 93,444 |
| Based on demographic estimates as of April 1, 2010 : | 94,412 |
| Based on demographic estimates as of 1 April 2010 : | -1.0% |
| April 1, 2020 Population : | 92,726 |
| April 1, 2010 Population : | 94,396 |
| People under 5 years old, percentage : | 6.8% |
| People under 18 years old, percentage : | 27.0% |
| People over 65 (%) : | 10.0% |
| Female persons, % : | 50.5% |
| White only, percent : | 62.9% |
| Black or African American alone, percent : | 0.7% |
| American Indian and Alaska Native only, % : | 0.6% |
| Asians alone % : | 0.5% |
| Only Native Hawaiians and Other Pacific Islanders, % : | 0.2% |
| % of people who have participated in two or more races : | 1.6% |
| % of Hispanic or Latino : | 95.6% |
| White people, not Hispanic or Latino people, make up the majority of the population. : | 2.9% |
| 2015-2019 Veterans : | 807 |
| Percentage of foreign-born people, 2015-2019 : | 42.4% |
| Rate of owner-occupied housing units, 2015-2019 : | 42.9% |
Economic Facts
| Rate of owner-occupied housing units, 2015-2019 : | 42.9% |
| Owner-occupied housing unit median value, 2015-2019 : | $408,200 |
| From 2015 to 2019, the median selected monthly owner costs - with a mortgage : | $1,944 |
| Monthly owner costs, without a mortgage, at the median, 2015-2019 : | $453 |
| 2015-2019 median gross rent : | $1,160 |
| 2015-2019 Households : | 24,071 |
| Population per household, 2015-2019 : | 3.93 |
| Living in the same house a year ago, percentage of people aged one year and up, 2015-2019 : | 93.1% |
| Languages other than English spoken at home, as a percentage of people aged 5 and up, 2015-2019 : | 88.3% |
| Households with computers, %, 2015-2019 : | 90.1% |
| Percentage of households with a broadband Internet subscription, 2015-2019 : | 83.5% |
| Percentage of people aged 25 and up with a high school diploma or higher, 2015-2019 : | 56.7% |
| Bachelor's degree or higher, proportion of people aged 25 and up, 2015-2019 : | 9.4% |
| Percentage of people under the age of 65 who have a disability, 2015-2019 : | 5.9% |
| Persons under the age of 65 who do not have health insurance, as a percentage : | 16.5% |
| Total civilian labor force, percent of population aged 16 and up, 2015-2019 : | 65.5% |
| Female labor force participation in the civilian labor force, as a percentage of the population aged 16 and up, 2015-2019 : | 56.7% |
| Total sales of lodging and food services in 2012 ($1,000) : | 74,381 |
| Total receipts/revenue for health care and social assistance in 2012 ($1,000) : | 84,350 |
| Manufacturers' total shipments in 2012 ($1,000) : | 1,778,091 |
| 2012 total retail sales ($1,000) : | 686,431 |
| 2012 total retail sales per capita : | $7,203 |
| Mean commute time to work (in minutes), workers aged 16 and up, 2015-2019 : | 32.9 |
| 2015-2019 median household income (in 2019 dollars) : | $52,321 |
| Income per capita in the previous 12 months (in 2019 dollars), 2015-2019 : | $18,031 |
| Percentage of people living in poverty : | 17.2% |
| Total number of businesses in 2012 : | 7,170 |
| Men-owned businesses in 2012 : | 3,852 |
| Women-owned businesses in 2012 : | 2,848 |
| Minority-owned businesses in 2012 : | 6,497 |
| Non-minority-owned businesses in 2012 : | 551 |
| Veteran-owned businesses in 2012 : | 375 |
| Nonveteran-owned businesses in 2012 : | 6,659 |
| 2010 population per square mile : | 13,045.0 |
| 2010 land area in square miles : | 7.24 |
| Rate of owner-occupied housing units, 2015-2019 : | 80.9% |
| Owner-occupied housing unit median value, 2015-2019 : | $223,600 |
| From 2015 to 2019, the median selected monthly owner costs - with a mortgage : | $1,936 |
| Monthly owner costs, without a mortgage, at the median, 2015-2019 : | $825 |
| 2015-2019 median gross rent : | $1,386 |
| 2015-2019 Households : | 22,921 |
| Population per household, 2015-2019 : | 3.23 |
| Living in the same house a year ago, percentage of people aged one year and up, 2015-2019 : | 90.7% |
| Languages other than English spoken at home, as a percentage of people aged 5 and up, 2015-2019 : | 35.0% |
| Households with computers, %, 2015-2019 : | 95.7% |
| Percentage of households with a broadband Internet subscription, 2015-2019 : | 90.7% |
| Percentage of people aged 25 and up with a high school diploma or higher, 2015-2019 : | 90.2% |
| Bachelor's degree or higher, proportion of people aged 25 and up, 2015-2019 : | 38.0% |
| Percentage of people under the age of 65 who have a disability, 2015-2019 : | 5.4% |
| Persons under the age of 65 who do not have health insurance, as a percentage : | 8.4% |
| Total civilian labor force, percent of population aged 16 and up, 2015-2019 : | 73.5% |
| Female labor force participation in the civilian labor force, as a percentage of the population aged 16 and up, 2015-2019 : | 69.2% |
| Total sales of lodging and food services in 2012 ($1,000) : | 173,468 |
| Total receipts/revenue for health care and social assistance in 2012 ($1,000) : | 287,555 |
| Manufacturers' total shipments in 2012 ($1,000) : | 1,168,963 |
| 2012 total retail sales ($1,000) : | 1,377,514 |
| 2012 total retail sales per capita : | $18,605 |
| Mean commute time to work (in minutes), workers aged 16 and up, 2015-2019 : | 31.5 |
| 2015-2019 median household income (in 2019 dollars) : | $91,290 |
| Income per capita in the previous 12 months (in 2019 dollars), 2015-2019 : | $34,781 |
| Percentage of people living in poverty : | 6.7% |
| Total number of businesses in 2012 : | 5,756 |
| Men-owned businesses in 2012 : | 2,792 |
| Women-owned businesses in 2012 : | 2,225 |
| Minority-owned businesses in 2012 : | 2,627 |
| Non-minority-owned businesses in 2012 : | 2,842 |
| Veteran-owned businesses in 2012 : | 408 |
| Nonveteran-owned businesses in 2012 : | 5,043 |
| 2010 population per square mile : | 3,050.7 |
| 2010 land area in square miles : | 24.05 |
| Rate of owner-occupied housing units, 2015-2019 : | 49.0% |
| Owner-occupied housing unit median value, 2015-2019 : | $47,900 |
| From 2015 to 2019, the median selected monthly owner costs - with a mortgage : | $946 |
| Monthly owner costs, without a mortgage, at the median, 2015-2019 : | $390 |
| 2015-2019 median gross rent : | $891 |
| 2015-2019 Households : | 4,932 |
| Population per household, 2015-2019 : | 2.83 |
| Living in the same house a year ago, percentage of people aged one year and up, 2015-2019 : | 87.1% |
| Languages other than English spoken at home, as a percentage of people aged 5 and up, 2015-2019 : | 5.0% |
| Households with computers, %, 2015-2019 : | 85.3% |
| Percentage of households with a broadband Internet subscription, 2015-2019 : | 67.3% |
| Percentage of people aged 25 and up with a high school diploma or higher, 2015-2019 : | 84.3% |
| Bachelor's degree or higher, proportion of people aged 25 and up, 2015-2019 : | 10.6% |
| Percentage of people under the age of 65 who have a disability, 2015-2019 : | 14.3% |
| Persons under the age of 65 who do not have health insurance, as a percentage : | 7.5% |
| Total civilian labor force, percent of population aged 16 and up, 2015-2019 : | 58.8% |
| Female labor force participation in the civilian labor force, as a percentage of the population aged 16 and up, 2015-2019 : | 56.4% |
| Total sales of lodging and food services in 2012 ($1,000) : | 14,412 |
| 2012 total retail sales ($1,000) : | 131,124 |
| 2012 total retail sales per capita : | $8,788 |
| Mean commute time to work (in minutes), workers aged 16 and up, 2015-2019 : | 23.2 |
| 2015-2019 median household income (in 2019 dollars) : | $35,663 |
| Income per capita in the previous 12 months (in 2019 dollars), 2015-2019 : | $18,045 |
| Percentage of people living in poverty : | 30.3% |
| Total number of businesses in 2012 : | 802 |
| Men-owned businesses in 2012 : | 244 |
| Women-owned businesses in 2012 : | 456 |
| Minority-owned businesses in 2012 : | 556 |
| Non-minority-owned businesses in 2012 : | 192 |
| Veteran-owned businesses in 2012 : | 79 |
| Nonveteran-owned businesses in 2012 : | 666 |
| 2010 population per square mile : | 1,621.0 |
| 2010 land area in square miles : | 9.40 |
| Rate of owner-occupied housing units, 2015-2019 : | 28.9% |
| Owner-occupied housing unit median value, 2015-2019 : | $117,500 |
| From 2015 to 2019, the median selected monthly owner costs - with a mortgage : | $1,153 |
| Monthly owner costs, without a mortgage, at the median, 2015-2019 : | $558 |
| 2015-2019 median gross rent : | $714 |
| 2015-2019 Households : | 10,492 |
| Population per household, 2015-2019 : | 2.08 |
| Living in the same house a year ago, percentage of people aged one year and up, 2015-2019 : | 58.1% |
| Languages other than English spoken at home, as a percentage of people aged 5 and up, 2015-2019 : | 13.3% |
| Households with computers, %, 2015-2019 : | 92.9% |
| Percentage of households with a broadband Internet subscription, 2015-2019 : | 78.9% |
| Percentage of people aged 25 and up with a high school diploma or higher, 2015-2019 : | 94.1% |
| Bachelor's degree or higher, proportion of people aged 25 and up, 2015-2019 : | 44.5% |
| Percentage of people under the age of 65 who have a disability, 2015-2019 : | 9.8% |
| Persons under the age of 65 who do not have health insurance, as a percentage : | 7.9% |
| Total civilian labor force, percent of population aged 16 and up, 2015-2019 : | 55.0% |
| Female labor force participation in the civilian labor force, as a percentage of the population aged 16 and up, 2015-2019 : | 58.1% |
| Total receipts/revenue for health care and social assistance in 2012 ($1,000) : | 426,209 |
| 2012 total retail sales ($1,000) : | 760,173 |
| 2012 total retail sales per capita : | $28,969 |
| Mean commute time to work (in minutes), workers aged 16 and up, 2015-2019 : | 15.0 |
| 2015-2019 median household income (in 2019 dollars) : | $22,152 |
| Income per capita in the previous 12 months (in 2019 dollars), 2015-2019 : | $19,866 |
| Percentage of people living in poverty : | 43.1% |
| Total number of businesses in 2012 : | 1,515 |
| Men-owned businesses in 2012 : | 808 |
| Women-owned businesses in 2012 : | 410 |
| Minority-owned businesses in 2012 : | 386 |
| Non-minority-owned businesses in 2012 : | 924 |
| Veteran-owned businesses in 2012 : | 146 |
| Nonveteran-owned businesses in 2012 : | 1,114 |
| 2010 population per square mile : | 1,516.0 |
| 2010 land area in square miles : | 17.09 |
Best Things to Do in Morton
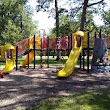
1Idlewood Park
450 E Greenwood St, Morton, IL 61550, United States View details
Phone: +13092637429 | Website available

2Birchwood Park
349 W Birchwood St, Morton, IL 61550, United States View details
Phone: +13092637429

3Mcclallen Park
401 N., Tennessee Ave, Morton, IL 61550, United States View details
Phone: +13092637429

4Northwood Park
22216 N Main St, Morton, IL 61550, United States View details
Phone: +13092637429

5Oakwood Park
22149, 22001 N Main St, Morton, IL 61550, United States View details
Phone: +13092637429
Where to Eat in Morton
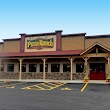
1Cracker Barrel Old Country Store
150 E Ashland St, Morton, IL 61550, United States View details
Phone: +13092632103 | Website available

2Pizza Ranch
903 W Jackson St, Morton, IL 61550, United States View details
Phone: +13092631200 | Website available
3Steak 'n Shake
151 E Ashland St, Morton, IL 61550, United States View details
Phone: +13092634210 | Website available

4Culver's
121 E Courtland St, Morton, IL 61550, United States View details
Phone: +13092635210 | Website available

5Burger King
1810 N Morton Ave, Morton, IL 61550, United States View details
Phone: +13092668300 | Website available

Where to Stay in Morton
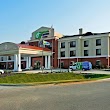
1Holiday Inn Express & Suites
140 E Ashland St, Morton, IL 61550, United States View details
Phone: +13092634400 | Website available
2Baymont by Wyndham Morton
210 E Ashland St, Morton, IL 61550, United States View details
Phone: +13092668888 | Website available

3Best Western Morton Inn
150 W Ashland St, Morton, IL 61550, United States View details
Phone: +13092669933 | Website available

4Days Inn by Wyndham Morton
101 E Ashland St, Morton, IL 61550, United States View details
Phone: +13093210100 | Website available
5Quality Inn
115 E Ashland St, Morton, IL 61550, United States View details
Phone: +13095246064 | Website available
Services and Civic Places in Morton
1Village of Morton- Village Hall
120 N Main St, Morton, IL 61550 View details
Phone: +13092665361 | Website available

People born in Morton (2)
People born in Morton, including Chairman, Tennessee Valley Authority and Atomic Energy Commission. David E. Lilienthal, businessman David Burritt, .
More notable people
Nearby Schools and Colleges
Schools and campuses linked to Morton, IL. Select a name to open its map and contact details.
| Code | Name | City | ZIP |
|---|---|---|---|
| 458265 | Midwest Technical Institute-East Peoria | East Peoria (IL) | 61611 |
Nearby Transit Stations (13)
Rail and bus stations connected to Morton, IL. Select a station to open its map and address details.
| Code | Name | Address | Type |
|---|---|---|---|
| PIA | Peoria, Illinois | 6100 West Everett M. Dirksen Parkway | BUS |
| BNL | Uptown Station | 100 East Parkinson St. | RAIL |
| LCN | Lincoln | Broadway and North Chicago Sts. | RAIL |
| PON | Pontiac station | 721 West Washington St. | RAIL |
| KEE | Kewanee | Loomis and North Tremont Sts. | RAIL |
Closest post offices linked to Morton.
| Post Office Name | City | ZIP |
|---|---|---|
| Morton Post Office | Morton (IL) | 61550 |
Other places with the same name (5)
- Morton, Mississippi city in Scott County, Mississippi, USA with a population of 3,522 people.
- Morton, Pennsylvania borough of Pennsylvania with a population of 2,668 people.
- Morton, Texas town in Texas, USA with a population of 1,840 people.
- Morton, Washington city in Lewis County, Washington, United States with a population of 1,217 people.
- Morton, Minnesota city in Minnesota, United States with a population of 369 people.
Other cities in Tazewell County
Cities, towns, neighborhoods & other populated places in Tazewell County , IL. (more)
| City Name | Population | Title |
|---|---|---|
| Pekin | 31,808 | County seat of Tazewell County, Illinois |
| East Peoria | 22,344 | City on the Illinois River in Tazewell County, Illinois, USA |
| Washington | 16,395 | City in Tazewell County, Illinois |
| Creve Coeur | 5,109 | Village in Illinois, United States |
| Marquette Heights | 2,617 | City in Tazewell County, Illinois, United States |
| Mackinaw | 2,430 | City in Tazewell County, Illinois, United States of America |
| Wesley | 2,130 | Township in Will County, Illinois |
| Tremont | 2,114 | City in Itawamba County, Mississippi, United States of America |
| Delavan | 1,596 | Township in Tazewell County, Illinois |
| North Pekin | 1,530 | Village in Illinois, USA |
| Minier | 1,180 | City in Tazewell County, Illinois, United States of America |
| South Pekin | 1,081 | Village in Illinois, USA |
| Hopedale | 998 | Township in Tazewell County, Illinois |
| Dillon | 957 | Human settlement in United States of America |
| Cooper | 862 | Unincorporated community in Illinois |
| Deer Creek | 657 | Village mostly in Tazewell County, Illinois, USA |
Distance to Other Cities
Morton distances to largest Illinois cities